Prometheus Stack Review
clux January 11, 2022 [software] #kubernetes #observability #prometheusAs part of my work life in the past year, a chunk of my day-to-day life has consisted of maintaining a prometheus installation on top of a sizable kubernetes cluster. My original feeling was "this is not that bad with kube-prometheus-stack", but this sentiment has worsened somewhat with the realisation that more and more customizations and pieces were needed for large scale use. Half a year later (and 6+ charts deep), I thought I'd collect my thoughts on the ecosystem - from an operational perspective - with a rough architecture overview post.
Disclaimer
- Information here is based on my own learnings. Some details might be wrong. Please submit an issue / fix if you see anything glaring.
- This post uses the classical open source
prometheussetup with HA pairs andthanoson top. There are other promising setups such as agent mode with remote write. - We are following the most-standard
helmapproach and using charts directly (i.e. avoiding direct use of jsonnet)
You can debate the last point, but if you are optimizing for user-editability of the prometheus-stack, then jsonnet is kind of the opposite of that - particularly when the rest of the cloud is installed with helm.
Architecture Overview
The TL;DR image. Open it up in a new tab, and cycle between if you want to read about specific components below.
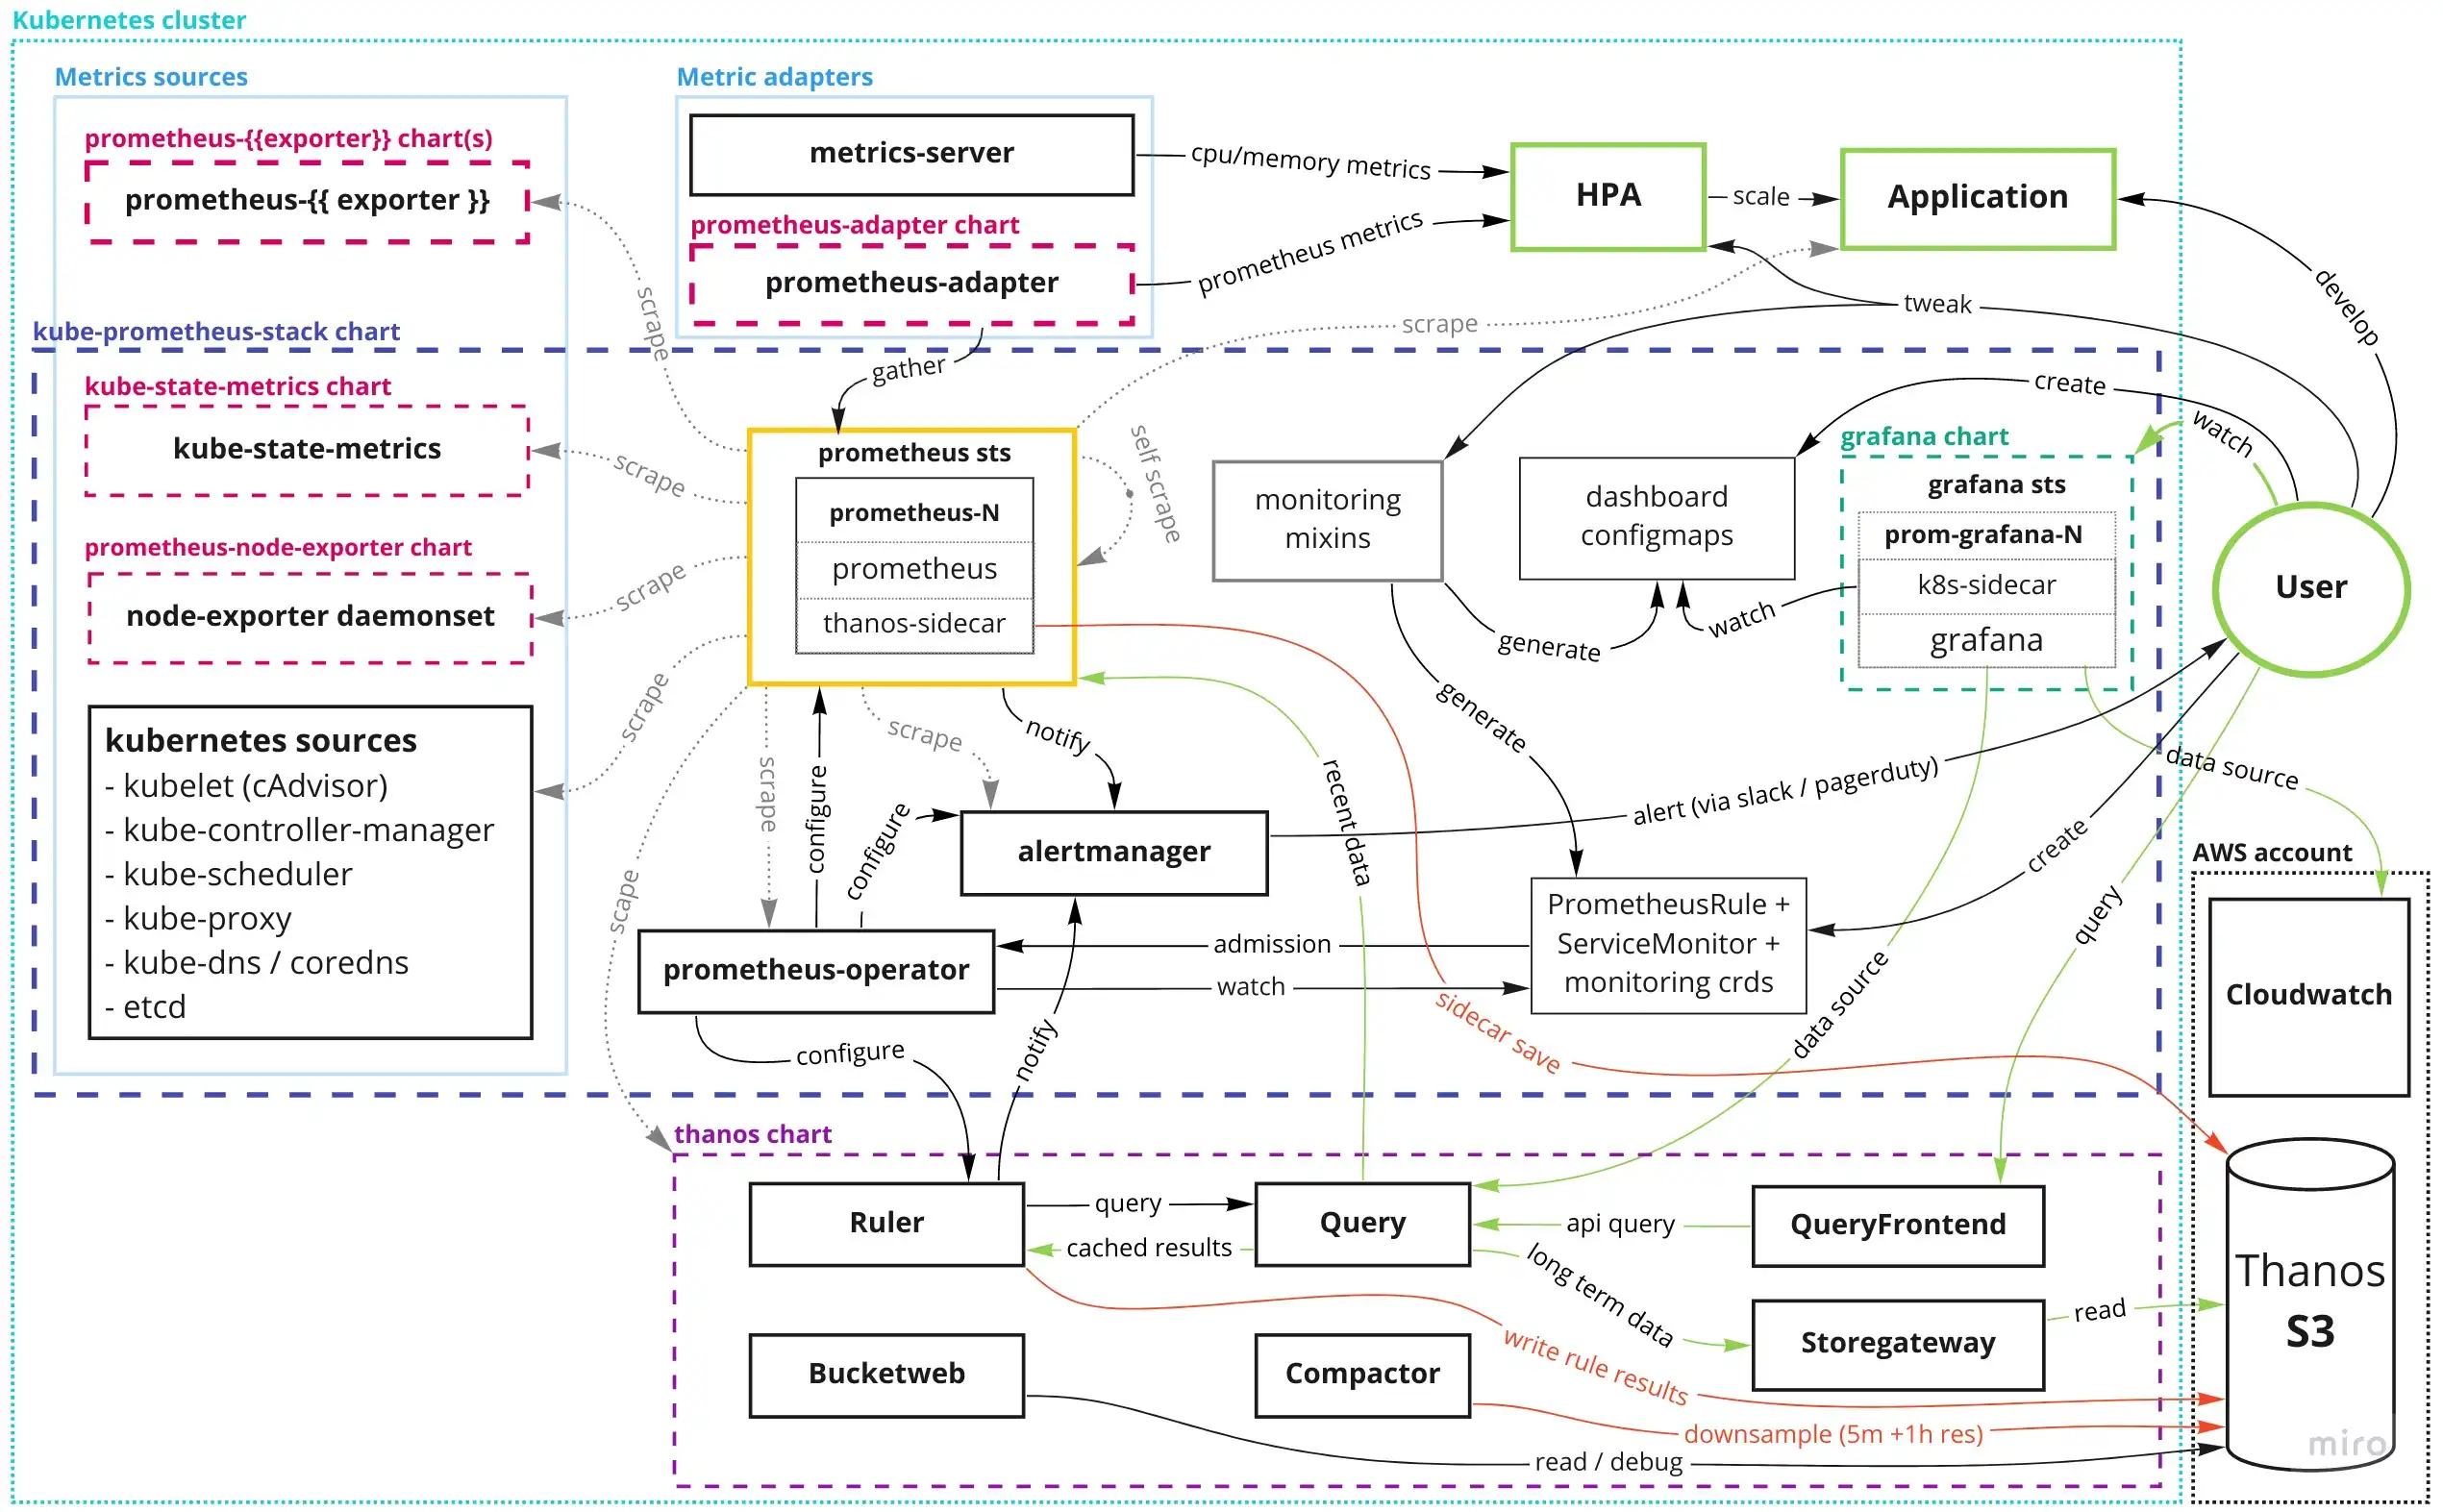
Legend:
- user components and the user read path is green
- prometheus/thanos write path is red.
helm chartsare denoted with thick dashed lines- arrows flow from the instigator of the verb to the object acted upon
Developer Interaction
A user / developer on a kubernetes cluster with the prometheus stack installed can be expected to:
- develop applications with hpas and have them scraped by prometheus for metrics
- create dashboards in grafana and save them as
ConfigMapentries - create alerting rules to be triggered when metrics exceed thresholds (and maybe even tweak existing mixins)
- query metrics directly on grafana's explore and thanos's queryfrontend
..and the user should not have to know too much about the complicated spaghetti setup that this diagram might give a scary impression of.
Part 1: kube-prometheus-stack
The blue dashed line represents a set of components that are commonly deployed together on kubernetes due to their interdependence, and these are managed together in the kube-prometheus-stack helm chart.
It is a ~3k LOC yaml values file with a further 71k LOC of yaml in that chart folder alone (what could go wrong), and it configures the following components:
- prometheus
- alertmanager
- prometheus-operator
- grafana
- kube-state-metrics
- node-exporter
- kubernetes specific monitors
- monitoring mixins
24k lines here are just the absolutely massive prometheus-operator crds (that are now too big to apply), but it's still an astonishing amount of yaml. Typically you'll end up with between 20-40k (excluding the crds) with a 100-500 line values file that you have to maintain (you generally don't want your values file to be too large as it becomes harder and harder to keep track of the breaking changes in the stringly typed helm chart apis).
prometheus
The octopus at the base of our architecture. Prometheus scrapes the metrics endpoints of virtually every application you have, stores the data locally in a low-retention (a week or two) time series database that you can query. (The grey scrape arrows are illustrative, whereas they would usually hit everything, and also hit it from every prometheus pod in the statefulset for redundancy).
It also continually computes configured evaluation rules, and raises alerts on configured metric thresholds.
Prometheus is over 9 years old, and has graduate maturity in cncf.
In theory, you can run it directly, tell it to scrape this-and-this and be done, but that will lead to downtime quickly. You are going to need at least two replicas for failover, and these are going to need mounted volumes to store their data. A StatefulSet in kubernetes.
For configuration; how to scrape metrics can be tweaked through a mounted scrape_config (a pretty complicated yaml DSL using snake_case). If you get the syntax wrong, prometheus hates your config and won't boot. promtool can validate it.
relabel_configs:
- source_labels:
action: keep
regex: true
- source_labels:
action: replace
target_label: __scheme__
regex: (https?)
- source_labels:
action: replace
target_label: __metrics_path__
regex: (.+)
- source_labels:
action: replace
target_label: __address__
regex: ([^:]+)(?::\d+)?;(\d+)
replacement: $1:$2
- action: labelmap
regex: __meta_kubernetes_service_label_(.+)
This config is pretty awful to write and debug manually, so imo, you should probably avoid writing it yourself (see the operator below).
Consider importing the semi-standardised prometheus.io/scrape ones from the main prometheus chart if you wish (they slightly clash with the root chart), but those should be it. Scrape config also needs you to inline secrets, so not great from a security perspective.
Alerting and recording rules are similarly configured and has same caveats (don't write them manually).
alertmanager
Alerts (the data in the special ALERTS{alertstate="firing"} metric) are sent from prometheus to alertmanager.

At least, this is usually what happens. The communication to and within alertmanager is probably the most annoying parts of this entire architecture.
A problem that keeps biting me is how prometheus can lose track of alertmanager ips, and fail to send alerts for hours. There are many issues related to this.
When alerts do actually get passed to alertmanager, they go through a pretty complicated internal architecture, before ultimately being sent to configured receivers. Alertmanager contains deduplication mechanisms, and a custom UDP & TCP gossip protocol (that keeps breaking in HA setups - causing duplicate alerts).
The built-in receivers for slack/pagerduty seem to handle deduplicating alerts themselves, so if you can get by without HA and don't need a custom webhook, you might be ok.
Still, your mileage will definitely vary with this component.
Alertmanager is almost 9 years old, has 2 maintainers, and is a sub-project of the prometheus org.
prometheus-operator
A system that sits on top of prometheus, and extends the configuration with the large monitoring.coreos.com CRDs. This operator watches these CRDs, validates them via admission, converts them to a prometheus compatible format, and injects them into the running prometheus via a config-reloader sidecar on the prometheus statefulset. The most commonly used configuration CRDs are PrometheusRule and ServiceMonitor.
This setup avoids you taking down prometheus when you/users write new or invalid configuration or alerts. It also provides a mechanism for referencing kubernetes Secret objects (avoiding encryption needs on the base configuration), and it is generally considered the standard abstraction for configuring prometheus scraping.
A minor, but debatable choice they have made, is to re-map the scrape_config keys to camelCase forcing you have to write half of your ServiceMonitor in camelCase (the keys), and the other half in snake_case (the values):
    - relabelings:
      - action: replace
        sourceLabels:
         - __meta_kubernetes_namespace
         targetLabel: kubernetes_namespace
The operator configures prometheus, alertmanager, and optionally also thanos ruler.
It is over 5 years old and considered beta. It's maintained by people who are mostly disjoint from the the prometheus maintainers. I.e. while this is not a first-class supported thing from prometheus, everyone uses it - and it is well-documented.
grafana
While prometheus does have sufficient querying functionality built in, it does not let you save these queries other than by a long-ass url, so realistically, users will want Grafana for dashboards and cool panel customization.
The key strength of Grafana lies in how it becomes the one-stop shop for querying & visualising anything when you buy into the ecosystem, and the huge amount of data sources they have available:
..plus tons more that you are less likely to run into (cloudwatch shown as one common case). Even if you only use if it against prometheus, it's still a generally painless component to install with tons of benefits.
Grafana is packaged as a small-ish grafana-maintained helm chart, which is pinned as a subchart under kube-prometheus-stack.
The chart contains some nice ways of making dashboard provisioning automatic (dashboards as configmaps), but this comes with its own pain points:
- need to verify dashboard json out-of-band (validity + uid presence)
- dashboards incur k8s size limits - 1MB on ConfigMap, 256kB applied annotation
- HA setups could split brain dashboards with partial saves (seems fixed now)
- provisioned dashboards are incompatible with built-in alerts
- future dashboard-as-code direction is very undecided
Regardless, the diagram shows how the user flow would be for this, and how it ends up being picked up by a sidecar in the grafana statefulset.
Addendum: Governance & Grafana Labs Sidenotes
Grafana has a more company driven governance model - it's maintained almost exclusively by people employed by Grafana Labs - and the company is clearly optimizing for their own cloud offering of a parallel subset of this ecosystem; Grafana Cloud.
This obvious conflict of interest does pollute the purity of ecosystem somewhat, but at least they have financing to move at the great pace they are moving. Some examples of their recent efforts:
- loki - a serious elastic contender for logs that integrates with grafana
- tempo - a super clean tracing backend that integrates with grafana
- well maintained helm charts for grafana/tempo/loki
- prometheus agent mode
Of course, there is the expectation that open source functionality not related to grafana cloud might be receiving less attention, but I can't really blame them for pursuing a sensible monetisation strategy.
I do hope Grafana OnCall manages to get something contributed upstream (outside the grafana monolith) so we can have a better alternative to alertmanager (as alertmanager has lots of issues and can only alert on prometheus data sources).
Monitoring Mixins
A default grafana/prometheus-operator installation is not going to be very helpful without some dashboards that tell you about the state of your system(s).
Common patterns for alerts/dashboards/recording rules are encapsulated in a collection of mixins that are browsable on monitoring.mixins.dev.
The kubernetes-mixin stands out in particular, providing excellent, high maturity, drill-down-linked dashboards that are going to be vital for a large percentage of kubernetes related incidents.
In general, these provide a great starting point for most clusters (despite sometimes being overly noisy). You likely have to re-configure some thresholds, and remove some of these alerts as you see fit you your production cluster, but the defaults are generally intelligent.
Unfortunately, there are many operational challenges with these mixins. helm is certainly not best suited to take full advantage of them as not every option is bubbled up to the charts, and these values flow through so many layers it's challenging to find where they truly originate, e.g. kube-prometheus-stack <- kube-prometheus <- prometheus-operator.
This often caused me not wanting to bother with fixing it in the first place, which of course leads to the mixins not being as good as they could be. AFAIKT, your options are:
- forking the mixins you care about and opting out of automatic upstream fixes
- post-template modifications of minor details with hacky solutions like sed/jq
- managing mixins out-of-band, aligning implicit default values with the charts, and customizing with jsonnet
- going through the drudgery of propagating mixin fixes through several repos
While I advocate for trying to propagate fixes when motivation strikes, forking mixins at least makes your yaml readable in your gitops repo, so it's actually a decent option - particularly given how awful the other solutions are.
Regardless, it's another useful, but imperfect component that you are going to need.
Metric Sources
We move on to the components that create most of your data in prometheus.
Using the mixins (or equivalent dashboards) effectively requires you having standard kubernetes metric sources configured (otherwise you will have missing values in all your mixin dashboards).
We will briefly run through these metric sources, focusing first on the ones that appear in the kube-prometheus-stack. In general, these are pretty-well behaved and low-maintenance, so there won't be too much to say about these.
node-exporter
The main external metric source. A prometheus org maintained DaemonSet component that scrapes system level unix metrics. It mounts /, /sys, and /proc - with hostPID and hostNetwork enabled - to grab extensive information about each node.
It's a sub-chart of kube-prometheus-stack, and it has a slew of configurable exporters, which can be configured from the chart, but the defaults from kube-prometheus-stack are likely good enough.
kube-state-metrics
The second stand-alone metric exporter for kubernetes. Maintained by kubernetes itself; kube-state-metrics is a smaller deployment that generates metrics from what it sees the state of objects are from the apiserver. It has client-go reflectors and uses the results of their long watches to populate metrics.
It's a conceptually pretty simple piece; an api -> metrics transformer, but kubernetes has a lot of apis, so definitely not something you want to write yourself.
In example terms; this component provides the base data for what you need to answer the questions like whether your:
- "
Podhas been in an unhealthy state for>Nminutes" - "
Deploymenthas failed to complete its last rollout inNminutes" - "
HorizontalPodAutoscalerhas been maxed out for>Nminutes"
..stuff that you can figure out with kubectl get -oyaml.
KSM is deployed via an in-tree subchart under kube-prometheus-stack.
You can configure what apis it provides metrics for under collectors.
Addendum: Label configuration caveat
The only issue I've run into with KSM is that the metric labels are often insufficient for integration with existing standard alerting setups (problem being that the generic alerts from kubernetes-mixin will fire, but it's hard to tell by the name of the deployment alone who should get that alert). This can be rectified with the metricLabelsAllowlist in the chart, e.g.:
    metricLabelsAllowlist:
    - "deployments=[app.kubernetes.io/name,app]"
    - "jobs=[app.kubernetes.io/name,app]"
    - "horizontalpodautoscalers=[app.kubernetes.io/name,app]"
to inject more labels (here app) from the root object onto metrics. Annoyingly, these only get injected into an informational _labels metric, so you'd have to extend kubernetes-mixin with big joins to get these values exposed in the alert:
diff --git development/rules-kubernetes-apps.yaml development/rules-kubernetes-apps.yaml
index e36496e..988d6a6 100644
- expr: kube_job_spec_completions{job="kube-state-metrics", namespace=~".*"} - kube_job_status_succeeded{job="kube-state-metrics", namespace=~".*"} > 0
+ expr: |-
+ (kube_job_spec_completions{job="kube-state-metrics", namespace=~".*"} -
+ kube_job_status_succeeded{job="kube-state-metrics", namespace=~".*"} > 0) *
+ on(job_name) group_left(label_app_kubernetes_io_name)
+ sum by (namespace, job_name) (kube_job_labels{job="kube-state-metrics", label_app_kubernetes_io_name=~".+"})
kubernetes internal sources
For poking at the internals of kubernetes, you can enable configurable scrapers for:
- kubelet
- kube-apiserver
- kube-controller-manager
- kube-scheduler
- kube-proxy
- coreDns or kubeDns
- etcd
There is some sparse documentation for these under kubernetes/cluster-admin.
These are a little more optional, but you need the kubelet metrics (via cadvisor), for the main kubernetes mixins, so make sure those are enabled.
The more superfluous ones that come with the kube-apiserver (particularly the burnrate stuff) are particularly heavy evaluation rules (saw a ~6 cores reduction after removing them from one busy prometheus pair). Imo, you probably only need some of these if you are a cloud provider.
Extra metrics exporters
Any additional metrics exporters are not part of the kube-prometheus-stack chart, but there are tons of exporters availble supported by the same prometheus-community, so would expect them to be of high quality based on their commit history and repository CI, but have otherwise not enough experience here.
Part 2: Thanos
Before this step, you can have a pretty self-contained prometheus stack where grafana's default data source would point at the prometheus' Service, and metrics would fade out after prometheus' retention period.
Thanos essentially takes all the components that's found inside prometheus, and allows you to deploy and scale them separately, while providing a prometheus compatible API for long term storage of metrics.
It relies on data being sent from any prometheus set - via a sidecar on prometheus (configurable via the kube-prometheus-stack chart) - to some provisioned object storage (here S3).
The write paths to the S3 bucket is highlighted in red on the diagram.
The various read paths are highlighted in green on the diagram, and show how various types of reads propagate to various systems (grafana is the normal entrypoint, but the query-frontend is also a nice way to debug thanos specifics closer to the source).
The thanos configuration is "almost" completely contained in the thanos chart (of your choice) and is marked with a dashed purple square.
"almost": S3 configuration is also needed in
kube-prometheus-stackfor writing
There are several charts that are trying to package the same thing for thanos:
- bitnami/thanos - most active
- banzai/thanos - pretty inactive
- thanos-community/helm-charts - "official", but clearly abandoned/out-of-date
They all have problems:
bitnamities itself to its own ecosystem, and is not based on the official jsonnetbanzaiis clearly outdatedthanos-communitycharts lacks developers (and they see helm users as a minority)
So far, the bitnami chart is the most appropriate for helm users.
It's an evolving ecosystem with many components, but none of them are as complicated to operate as the kube-prometheus-stack components (and there seems to be a lot less footguns).
Thanos is an incubating cncf project that is just over 4 years old. It has a healthy set of maintainers, it moves fast, and makes some of the most well-documented, high-quality releases out there.
While it's not trivial to maintain - the large cpu/memory usage and scaling profiles presents some challenges - it has generally not presented major problems.
A quick run-through of things worth knowing about the components follows:
Thanos Query Frontend
The http UI users can use. Very light-weight. The Service for this Deployment generally becomes the default user substitute way to query anything (instead of going to a prometheus service's web interface - which after installing thanos is mostly useful for debugging scrape configs).
It also looks almost exactly like the prometheus web interface (sans ability to debug scrape targets).
This proxies all traffic to thanos query and never breaks.
Thanos Query
The big fan-out engine that fetches query data from one or more metric sources (typically thanos store + prometheus services), and computes the result of your query on the retrieved data.
This component will suddenly spike in both CPU and memory when it's under heavy load (i.e. users doing big queries), so an HPA here on CPU works OK - albeit some stabilization values might be useful:
  scaleTargetRef:
    apiVersion: apps/v1
    kind: Deployment
    name: prometheus-stack-thanos-query
  minReplicas: 2
  maxReplicas: 10
  # Slow down scaleDown behavior as thanos query has very sporadic usage
  behavior:
    scaleDown:
      stabilizationWindowSeconds: 100
      policies:
      - type: Percent
        value: 10
        periodSeconds: 60
    scaleUp:
      policies:
      - type: Percent
        value: 20
        periodSeconds: 15
  metrics:
  - type: Resource
    resource:
      name: cpu
      target:
        averageUtilization: 70
        type: Utilization
The compute workload kubernetes-mixin dashboard will show roughly how this HPA reacts to changes (stacked view, colors represent pods):
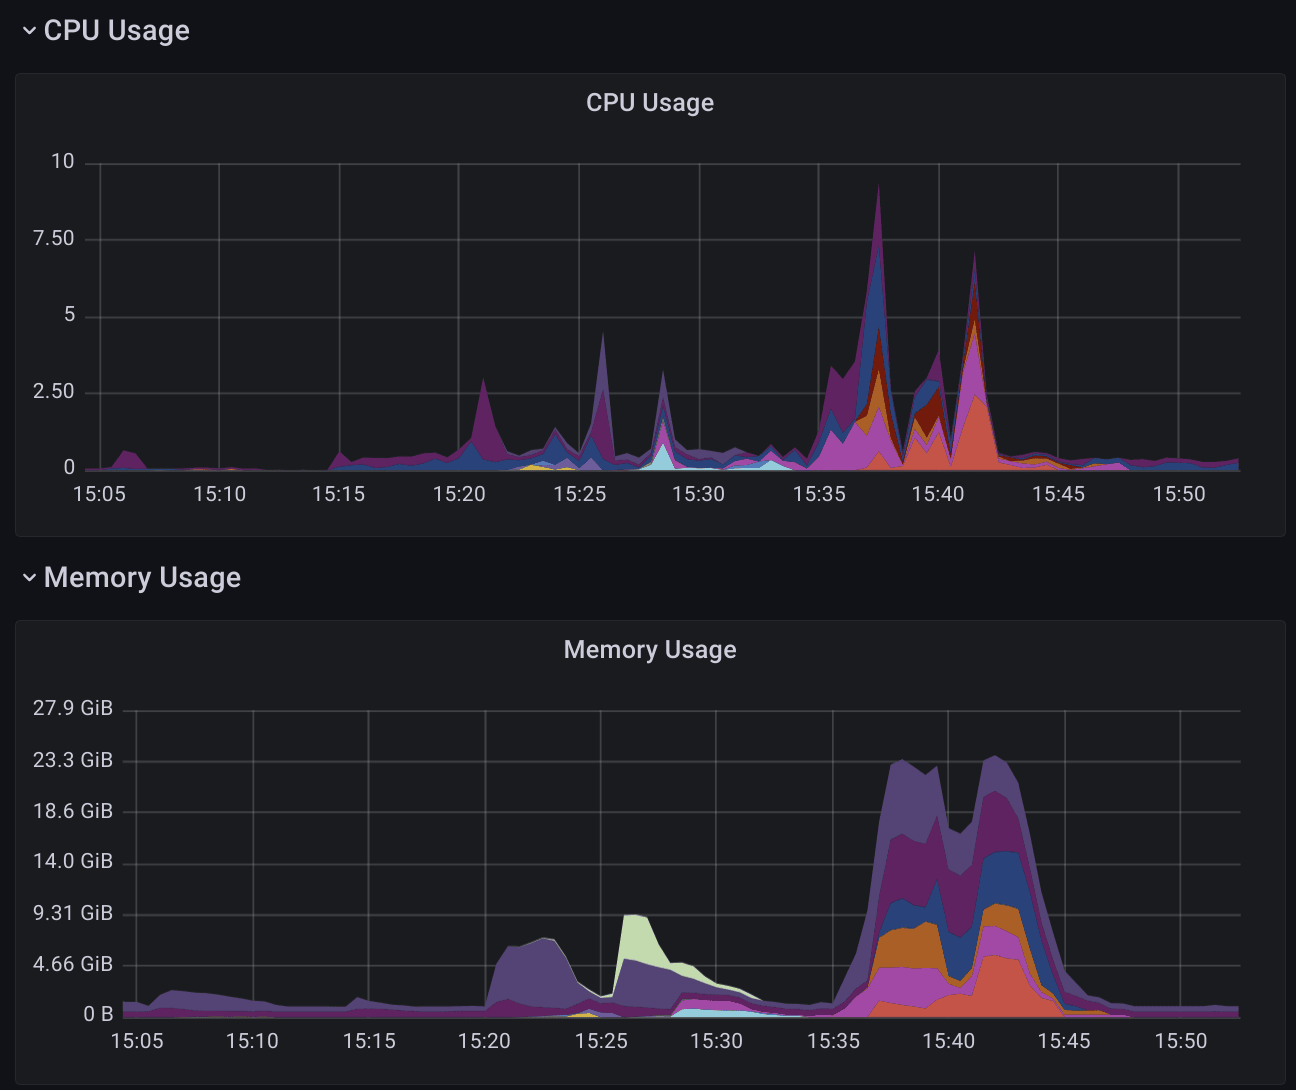
which lines up with the thanos_query_concurrent_gate_queries_in_flight metric reasonably well.
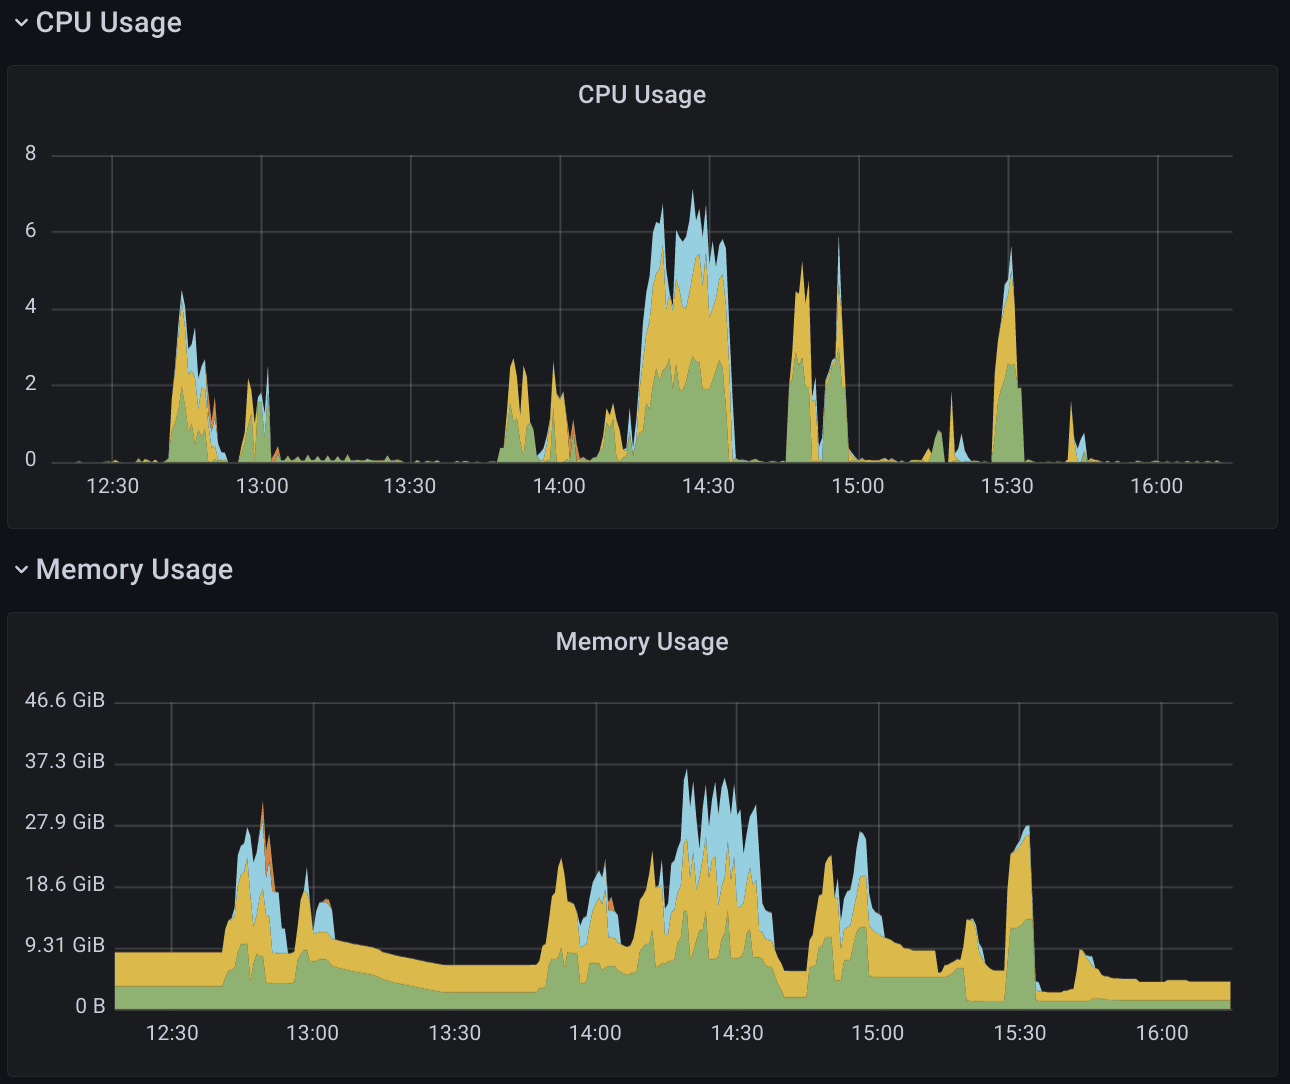
Thanos Store
The read interface to long term storage. It's also prometheus api compatible (using the Store API), so from the querier's POV it is analogous to querying a prometheus.
This component also will also suddenly spike in both CPU and memory when users start doing big queries on historical data (i.e. further back in time than prometheus' retention), so a similar HPA to thanos query to scale on CPU works reasonably well:
Thanos Ruler
An optional rule evaluation / alerting analogue. Not pictured in the current image because it's not really needed in the normal thanos setup (see the next #prometheus post for how this could be used). This is a bit more niche than the rule evaluation in prometheus itself, because rule evalution on the prometheus side already gets stored as metrics in the long term storage. The only reasons you need this is if you need to alert / evaluate rules on the federated level (e.g. to answer whether you have a high error rate across all production clusters / prometheus sets), or need long term metrics in the evaluation phase for anomaly detection.
If you need the alerting part, then you have another component that talks to alertmanager 🙃.
Can run in a stateful mode - presenting a prometheus compatible store api that the querier can hit for rule results - or statelessly; persisting rule results to s3.
Thanos Compactor
The magic sauce that makes querying long term data practical - as raw data is too resource intensive to use when you want to view result over the past weeks or months.
The compactor will go through the S3 bucket, and create lower-res data (at 5m averages and 1h averages), and delete raw data (after a configurable time has passed).
One such configuration can be:
- Maintain
rawresolution for7d - Create
5mresolution chunks that are kept for30d - Create
1hresolution chunks that are kept for1y
The compactor will chug along and do these in steps (creating 5m res from raw, then creating 1h res from 5m res), as the chunks become available.
Long-term, the lower res data is more practical to both query and store, but you end up with multiple variants of the data in the first 7 to 30 days.
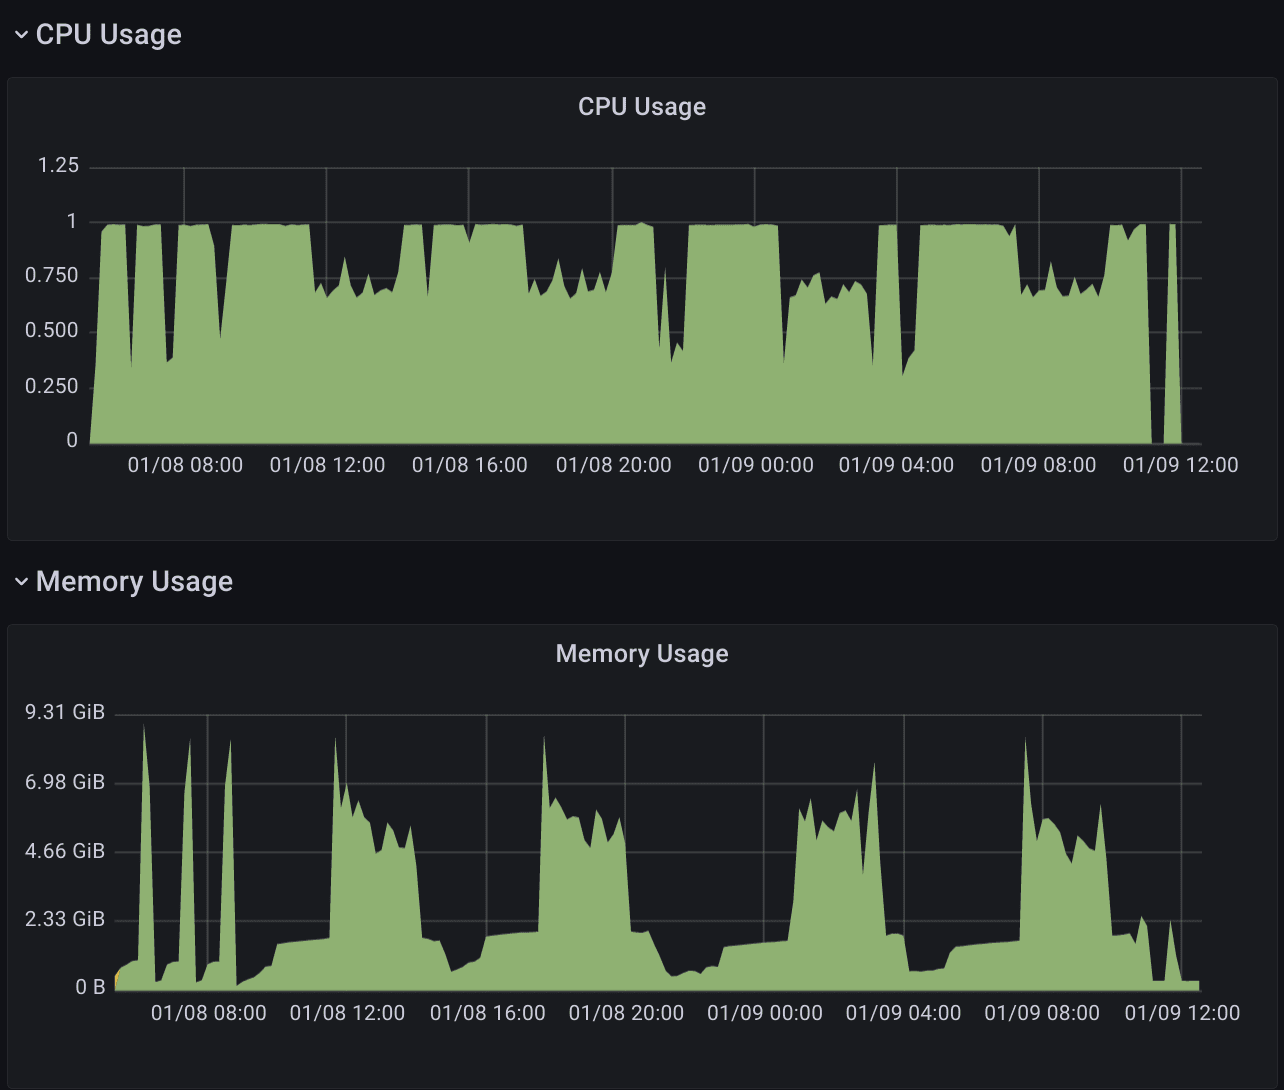
If this is hard to visualize, then fear not, you can browse to thanos bucket web to visualise the state of your S3 bucket. It's a small service (included in the chart) that presents the view, and what resolutions are availble from various dates.
Think of compactor as a cronjob (but with good alerts) that needs to do big data operations. If you give it enough space, cpu, and memory it is usually happy. It will use these resources a bit sporadically though - some cycles are clearly visible in memory use:
Part 3: Metrics API Integrations
The final components reside in the void outside the two big standard charts and contains the implementors of the various metrics apis:
- resource metrics api (cpu/memory for pods)
- custom metrics api (metrics related to a scalable object)
- external metrics api (metrics unrelated to a scalable object)
These are apis that allow Kubernetes to scale your workloads (with varying degrees of intelligence) through HPAs, but you need something to implement them.
I mention these different underlying apis explicitly because currently you can only have one implementor of each api, and if you have more than one thing that provides custom metrics (like say cloudwatch metrics + prometheus adapter), then you are better served by using KEDA than what is described herein.
metrics-server
The first is a kubernetes standard component; the metrics-server.
It only implements the resource metrics api, and thus only enables you scale on cpu and memory.
It extracts cpu/memory values values via kubelet, and as such allows kubectl top + HPAs to work out of the box - without prometheus or any of the other components visualised herein. It's even installed on k3d by default.
prometheus-adapter
This adapter funnels metrics from prometheus into the HPA universe, so you can scale on arbitrary metrics.
It implements the resource metrics, custom metrics, and external metrics APIs. The underlying setup for this has stable docs from k8s 1.23, and in essence this allows you to scale on custom metrics (related to the scaling object) or external metrics (unrelated to the scaling object).
The syntax needed for this component definitely leaves a lot to be desired. The only way we have managed to get somewhere with this is with principal engineers and a lot of trial and error. Thankfully, there are some helpful resources, this is still not easy.
The repository for prometheus-adapter is also not receiving a whole of attention: almost half of their closed issues looks like they were closed by kubernetes org's auto-closer bot. You can say many sensible things about this closing practice - on the importance of funding and triagers for open source software - but it ultimately sends a message:
twitter (rip), June 23, 2021, Benjamin Elder (@BenTheElder): Unpopular opinion: I think solving issue triage by letting robots auto close issues that were never responded to is a horrible way to manage your project and tells users you don't give a crap about their effort filing bugs :(
It does have its own prometheus-community maintained chart, which is of high quality, but you will need to figure out the templated promql yourself.
Without having much experience with KEDA, I would recommend looking into using KEDA's prometheus scaler directly instead of using the arcane template magic from prometheus-adapter.
Happy new year
That's all I can bring myself to write about this archeticture for now. It took longer than I anticipated, so hopefully this was useful to someone. Regardless, best of luck maintaining prometheus in 2022.