Running a Minimal Prometheus
clux September 07, 2024 [software] #kubernetes #observability #prometheus #homelabPrometheus does not need to be hugely complicated, nor a massive resource hog, provided you follow some principles.
Background
My last #prometheus posts have been exclusively about large scale production setups, and the difficulties this pulls in.
I would like to argue that these difficulties are often self-imposed, and a combination result of inadequate cardinality control and induced demand.
👺: You should be able to run a prometheus on your handful-of-machine-sized homelab with <10k time series active, using less than 512Mi memory, and 10m CPU.
Disclaimer: Who am I?
I am a platform engineer working maintenance of observability infrastructure, and a maintainer of kube-rs working on rust integration of observability with Kubernetes platforms. My knowledge of prometheus is superficial and mostly based on practical observations around operating it for years. Suggestions or corrections are welcome (links at bottom).
Signals, Symptoms & Causes
To illustrate this, let's try to answer the (perhaps obvious question): why do you install a metrics system at all?
Primarily; we want to be able to track and get notified on changes to key signals. At the very basic level you want to tell if your "service is down", because you want to be able to use it. That's the main, user-facing signal. Setup something that test if the service responds with a 2XX, and alert on deviations. You don't even need prometheus for this.
However, while you can do basic sanity outside the cluster, you need utilisation and saturation, to tell you about less obvious / upcoming failures:
- message queues full :: rejected work
- high cpu utilisation :: degraded latency
- memory utilisation high :: oom kill imminent
- disk space nearing full :: failures imminent
You can argue idealistically about whether you should only be "aware of something going wrong", or be "aware that something is in a risky state" (e.g. symptoms not causes), but utilisation/saturation/errors are ultimately very good indications/predictors for degraded performance, so we will focus on these herein.
How Many Signals
MAIN POINT: You should be able to enumerate the basic signals that you want to have visibility of.
Let's do some simplified enumeration maths on how many signals you actually want to properly identify failures quickly.
Compute Utilisation/Saturation
Consider an example cluster with 200 pods, and 5 nodes.
- Want {utilization,saturation} of {cpu,memory} at cluster level :: 2 * 2 = 4 signals
- Want to break these down per
Pod:: 200 * 4 = 800 signals - Want to break these down per
Node:: 5 * 4 = 20 signals
So, in theory, we should be able to visualise cluster, node, and pod level utilisation for cpu and memory with only 820 metrics (but likely more if you want to break down node metrics).
NB: Pods are only found on one node, so
Podcardinality does not multiply withNodecardinality.
These will come from a combination of cadvisor and kube-state-metrics; huge beasts with lots of functionality and way more signals than we need. Depending on how much of the kubernetes mixin you want, you may want more signals.
Node State Breakdown
If you want to break down things within a node on a more physical level, then you you can also grab node-exporter.
Assuming, for simplicity, 10 cores per node, 10 disk devices per node, and 10 network interfaces:
- Want {utilization,saturation,errors} of cpu :: 3*10 * 5 = 60 signals
- Want {utilization,saturation,errors} for memory :: 3*5 = 15 signals
- Want {utilisation,saturation,errors} of disks :: 3*10 * 5 = 100 signals
- Want {utilisation,saturation,errors} of network interfaces :: 10*3 * 5 = 150 signals
In theory, you should be able to get decent node monitoring with less than 400 metrics.
In Practice
Doing this type of enumeration is helpful as a way to tell how close you are to your theoretical 100% optimised system, but how does the number hold up in practice?
Metric Inefficiencies
The problems with expecting this type of perfection in practice is that many metric producers are very inefficient / overly lenient with their output. You can click on the addendum below for some examples, but without extreme tuning you can minimally expect a 5x inefficiency factor to apply to the above in practice.
Addendum: Inefficiency Examples
Take for instance, job="node-exporter" putting tons of labels on metrics such as node_cpu_seconds_total:
{cpu="15", mode="idle"} 1
{cpu="15", mode="iowait"} 1
{cpu="15", mode="irq"} 1
{cpu="15", mode="nice"} 1
{cpu="15", mode="softirq"} 1
{cpu="15", mode="steal"} 1
{cpu="15", mode="system"} 1
{cpu="15", mode="user"}
Maybe you dont care about either of these splits, you just want to have a cpu total and data for one mode.
Well, firstly, it's hard to get rid of mode because the standard recording rules depend on mode. Secondly, while you could try to rid of cpu, there's no great way of doing this without something like stream aggregation as labeldrop: cpu leads to collisions.
Similarly, if you want to support a bunch of the mixin dashboards with container level breakdown, you are also forced to grab a bunch of container level info for e.g. k8s.rules.container_resource unless if you want to rewrite the world.
And on top of this, many of these exporters also export things in very suboptimal ways. E.g. job="kube-state-metrics" denormalising disjoint phases (never letting old/zero phases go out of scope):
kube_pod_status_phase{phase="Pending", pod="forgejo-975b98575-fbjz8"} 0
kube_pod_status_phase{phase="Succeeded", pod="forgejo-975b98575-fbjz8"} 0
kube_pod_status_phase{phase="Failed", pod="forgejo-975b98575-fbjz8"} 0
kube_pod_status_phase{phase="Unknown", pod="forgejo-975b98575-fbjz8"} 0
kube_pod_status_phase{phase="Running", pod="forgejo-975b98575-fbjz8"} 1
This particular one may get a fix though.
Visualising Cardinality
I have a dashboard for this with this panel:
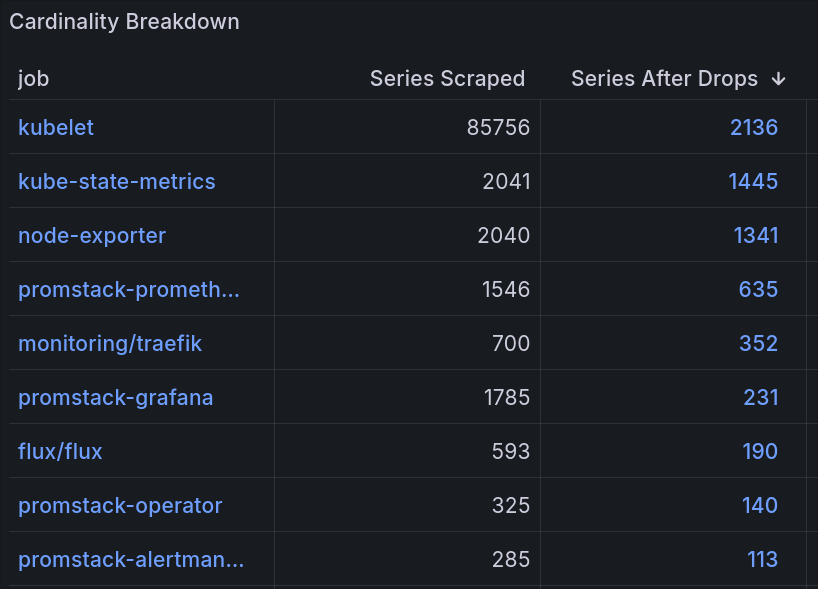
Shows metrics produced, how many we decided to keep, and a breakdown link leading to topk(50, count({job="JOB-IN-ROW"}) by (__name__)). It's probably the panel that has helped the most in slimming down prometheus.
Outing Out
The most unfortunate reality is that this stuff is all opt-out. The defaults are crazy inclusive, and new versions of exporters introduce new metrics forcing you to watch your usage graph upgrades.
Thankfully, in a gitops repo this is easy to do (if you actually generate your helm templates into a deploy folder) because all your dashboards and recording rules live there.
Procedure: Unsure if you need this container_sockets metric? rg container_sockets deploy/ and see if anything comes up:
- No hits?
action: drop. - Only used in a dashboard? Do you care about this dashboard? No?
action: drop. - Used in a recording rule? Does the recording rule go towards an alert/dashboard you care about? No?
action: drop.
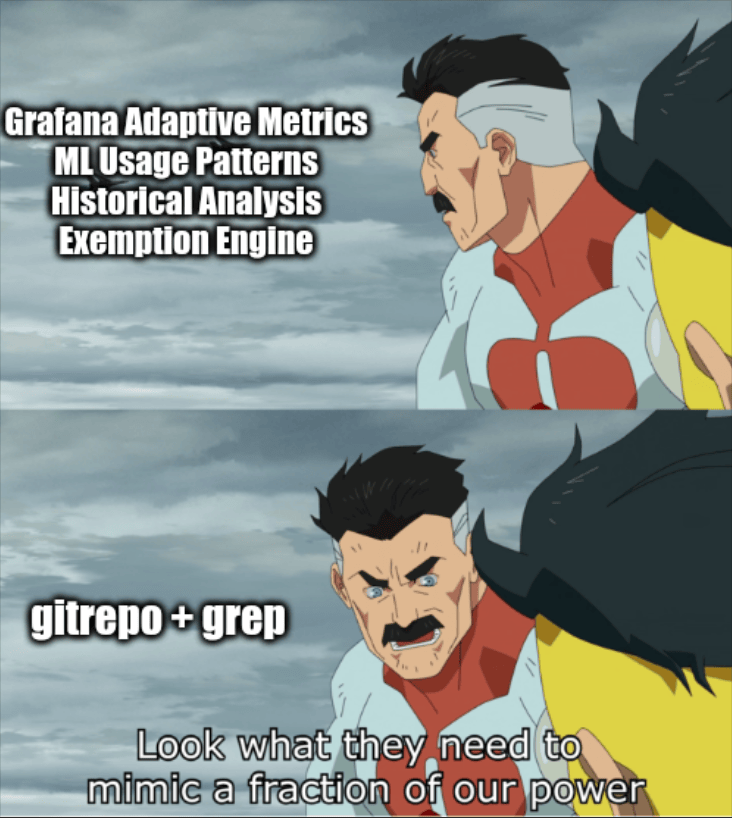
Grafana cloud has its own opt-out ML based adaptive metrics thing to do this, and it's probably helpful if you are locked into their cloud. The solution definitely has a big engineering solution feel to it, but can't really blame it as it's not like you can easily remove polluting labels from needed metrics these days without causing collisions in OSS prom.
Things You Don't Need
Sub Minute Data Fidelity
You are probably checking your homelab once every few days at most, so why do you expect you would need 15s/30s data fidelity? You can set 60s scrape/eval intervals and be fine:
scrapeInterval: 60s
evaluationInterval: 60s
You could go even higher, but above 1m grafana does starts to look less clean.
To compensate, you can hack your mixin dashboards to increase the time window, and set a less aggressive refresh:
# change default refreshes on grafana dashboards to be 1m rather than 10s
# change default time range to be now-12h rather than now-1h on boards that cannot handle 2 days...
# change default time range to be now-2d rather than now-1h on solid dashboards...
..which is actually practical if you use helm template rather than helm upgrade.
👺: Somewhere out there,
jsonnetusers are gouging their eyes out reading this.
Most Kubelet Metrics
97% of kubelet metrics are junk. In a small cluster it's the biggest waste producer in a small cluster, often producing 10x more metrics than anything else. Look at the top 10 metrics they produce with just 1 node and 30 pods:
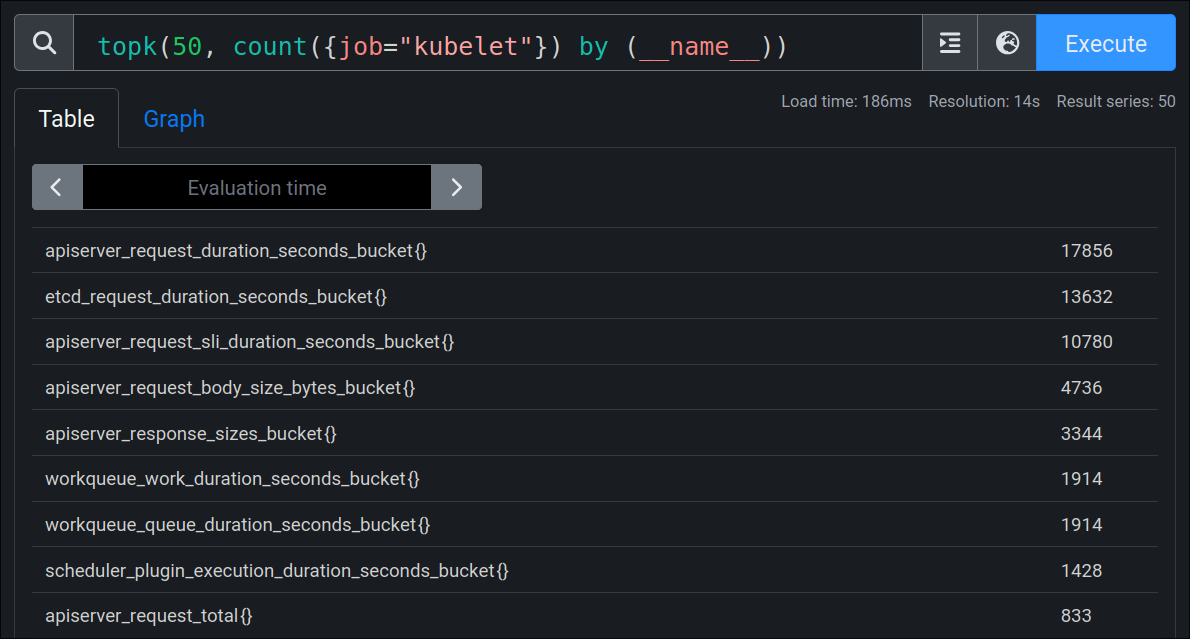
None of these are useful / contribute towards my above goal. Number 4 and 5 on that list together produce more signals than I consume in TOTAL in my actual setup. The kube-prometheus-stack chart does attempt to reduce this somewhat, but it by far too little.
Histograms
Histograms generally account for a huge percentage of your metric utilisation. On a default kube-prometheus-stack install with one node, the distribution is >70% histograms:
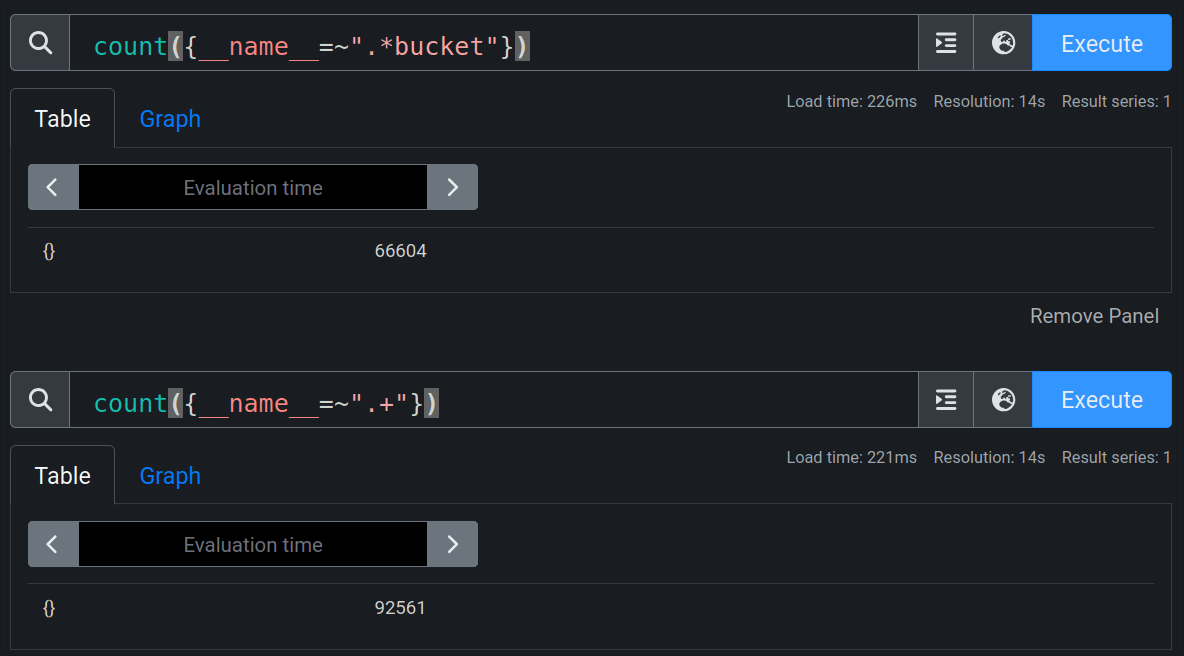
Of course, this is largely due to kubelet metric inefficiencies, but it's a trend you will see repeated elsewhere (thankfully usually with less eye-watering percentages).
Unless you have a need to see/debug detailed breakdown of latency distributions, do not ingest or produce these metrics (see addendum for more info). It's the easiest win you'll get in prometheus land; wildcard drop them from your ServiceMonitor (et al) objects:
metricRelabelings:
- sourceLabels:
action: drop
regex: '^.*bucket.*'
Addendum: Why does histograms suck?
- Multiplicative Cardinality: histogram buckets multiply metric cardinality by 5-30x (the number of buckets).
This number is multiplicative with regular cardinality:
pod/nodelabels added by prometheus operator :: if 2000 metric per pod, and scaling to 20 pods, now you have 40000 metrics- request information added by users (endpoint, route, status, error) :: 5 eps * 10 routes * 8 statuses * 4 errors = 1600 metrics, but with 30 buckets = 48000
- See the Containing Your Cardinality talk for more maths details
- Inefficiency 30x multiplied information is a bad way to store a few additional signals
If you want P50s or P99s you can compute these in the app with things like rolling averages or rolling quantiles. Some of these are more annoying than others, but there's a lot you can do by just tracking a mean.
Strive for one signal per question where possible.
That said, if you do actually need them, try to decouple them from your other labels (drop pod labels, drop peripheral information) so that you can get the answer you need cheaply. A histogram should answer one question, if your histogram has extra parameters, you can break them down to smaller histograms (addition beats multiplication for cardinality)
👺: Histograms will get better with the native-histograms feature (see e.g. this talk). However, this requires the ecosystem to move on to protobufs and it being propagated into client libraries (and is at the moment still experimental at the time of writing), it's only been 2 years though.
A Solution
Because I keep needing an efficient, low-cost homelab setup for prometheus (that still has the signals I care about), so now here is a chart.
It's mostly a wrapper chart over kube-prometheus-stack with aggressive tunings / dropping (of what can't be tuned), and it provides the following default values.yaml.
You could use it directly with:
but more sensibly, you can take/dissect the values.yaml file and run with it in your own similar subchart.
👺: You shouldn't trust me for maintenance of this, and you don't want to be any more steps abstracted away from
kube-prometheus-stack.
Architecture Diagram
The chart is effectively a slimmed down 2022 thanos setup; no HA, no thanos, no prometheus-adapter, but a including a lightweight tempo for exemplars:
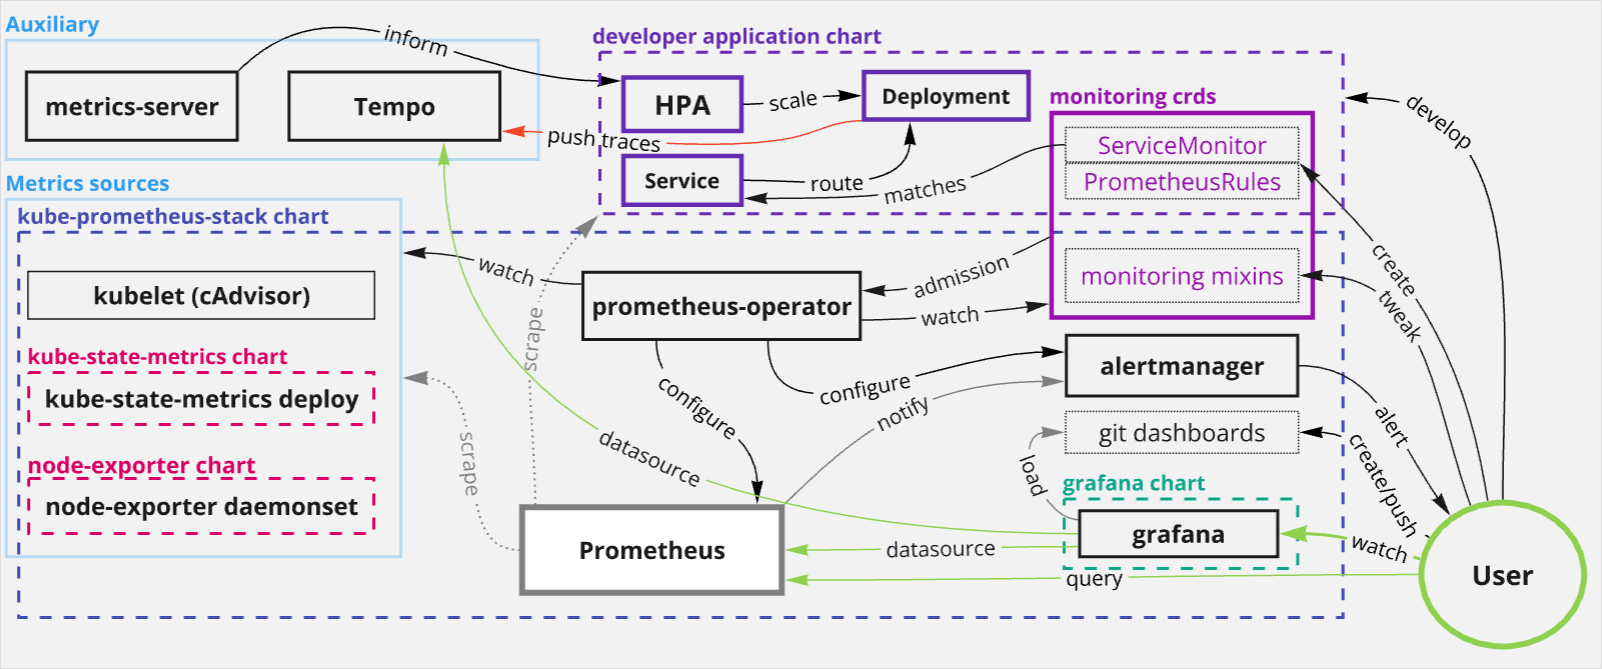
Features
A low-compromises prometheus, all the signals you need at near minimum cost.
Cardinality Control
Drops 97% of kubelet metrics, configures minimal kube-state-metrics, node-exporter (with some cli arg configurations and some relabelling based drops) and a few other apps. In the end we have a cluster running with 7000 metrics.
It's higher than my idealistic estimate - particularly considering this is a one node cluster atm. It can definitely be tuned lower with extra effort, but this is a good checkpoint. This is low enough that grafana cloud considers it free. So is it?
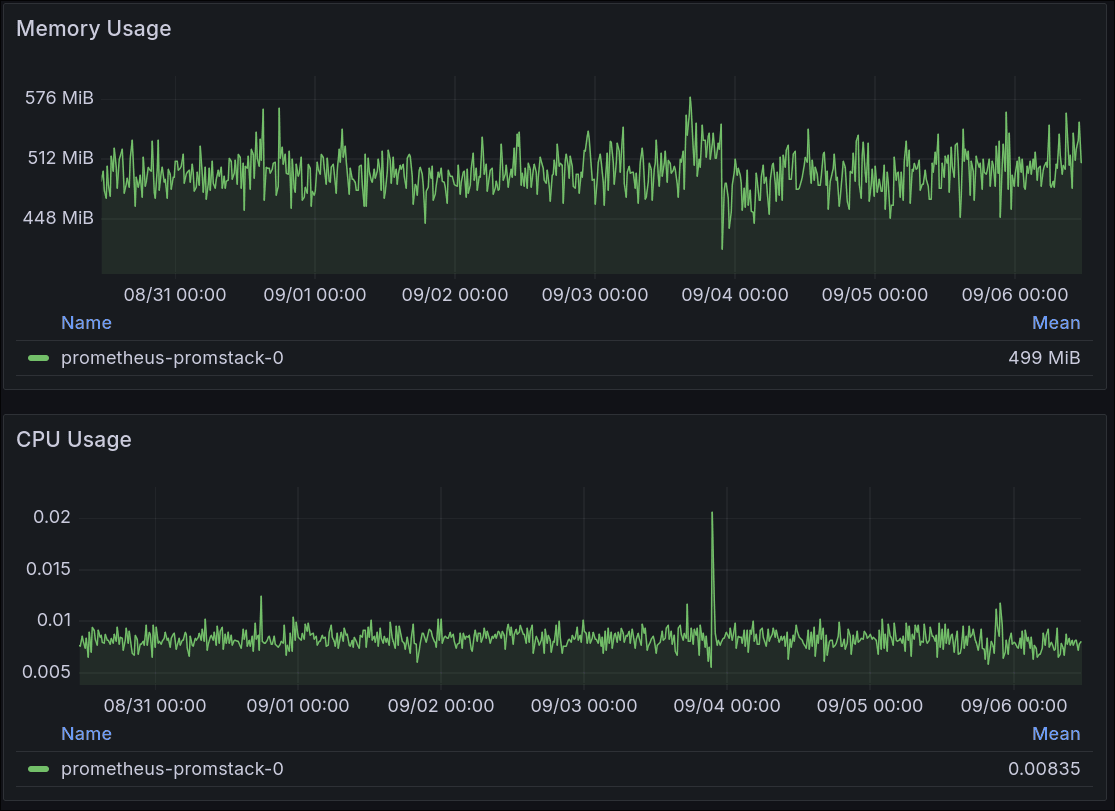
Low Utilization
The end result is a prometheus averaging <0.01 cores and with <512Mi memory use over a week with 30d retention:
Auxilary Features
- Tempo for exemplars, so we can cross-link from metric panels to grafana's trace viewer.
- Metrics Server for basic HPA scaling and
kubectl top.
👺: You technically don't need
metrics-serverif you are in an unscalable homelab, but having access tokubectl topis nice. Another avenue for homelab scaling is keda with its scale to zero ability.
CX Dashboards
The screenshots here are from my own homebrew cx-dashboards released separately. See the future post for these.
Links / Comments
Posted on mastodon. Feel free to comment / raise issues / suggest an edit.