You Will (Not) Scale Prometheus
clux August 15, 2024 [software] #kubernetes #observability #prometheus #thanosTo aid a memory obese prometheus, I recently helped in attempting to slowly shift a cluster over to prometheus agent mode sending data to thanos receive over the last couple of months. I have now personally given up on this goal due to a variety of reasons, and this post explores why.
Background Setup
The original setup we started out with is basically this (via 2022 ecosystem post):
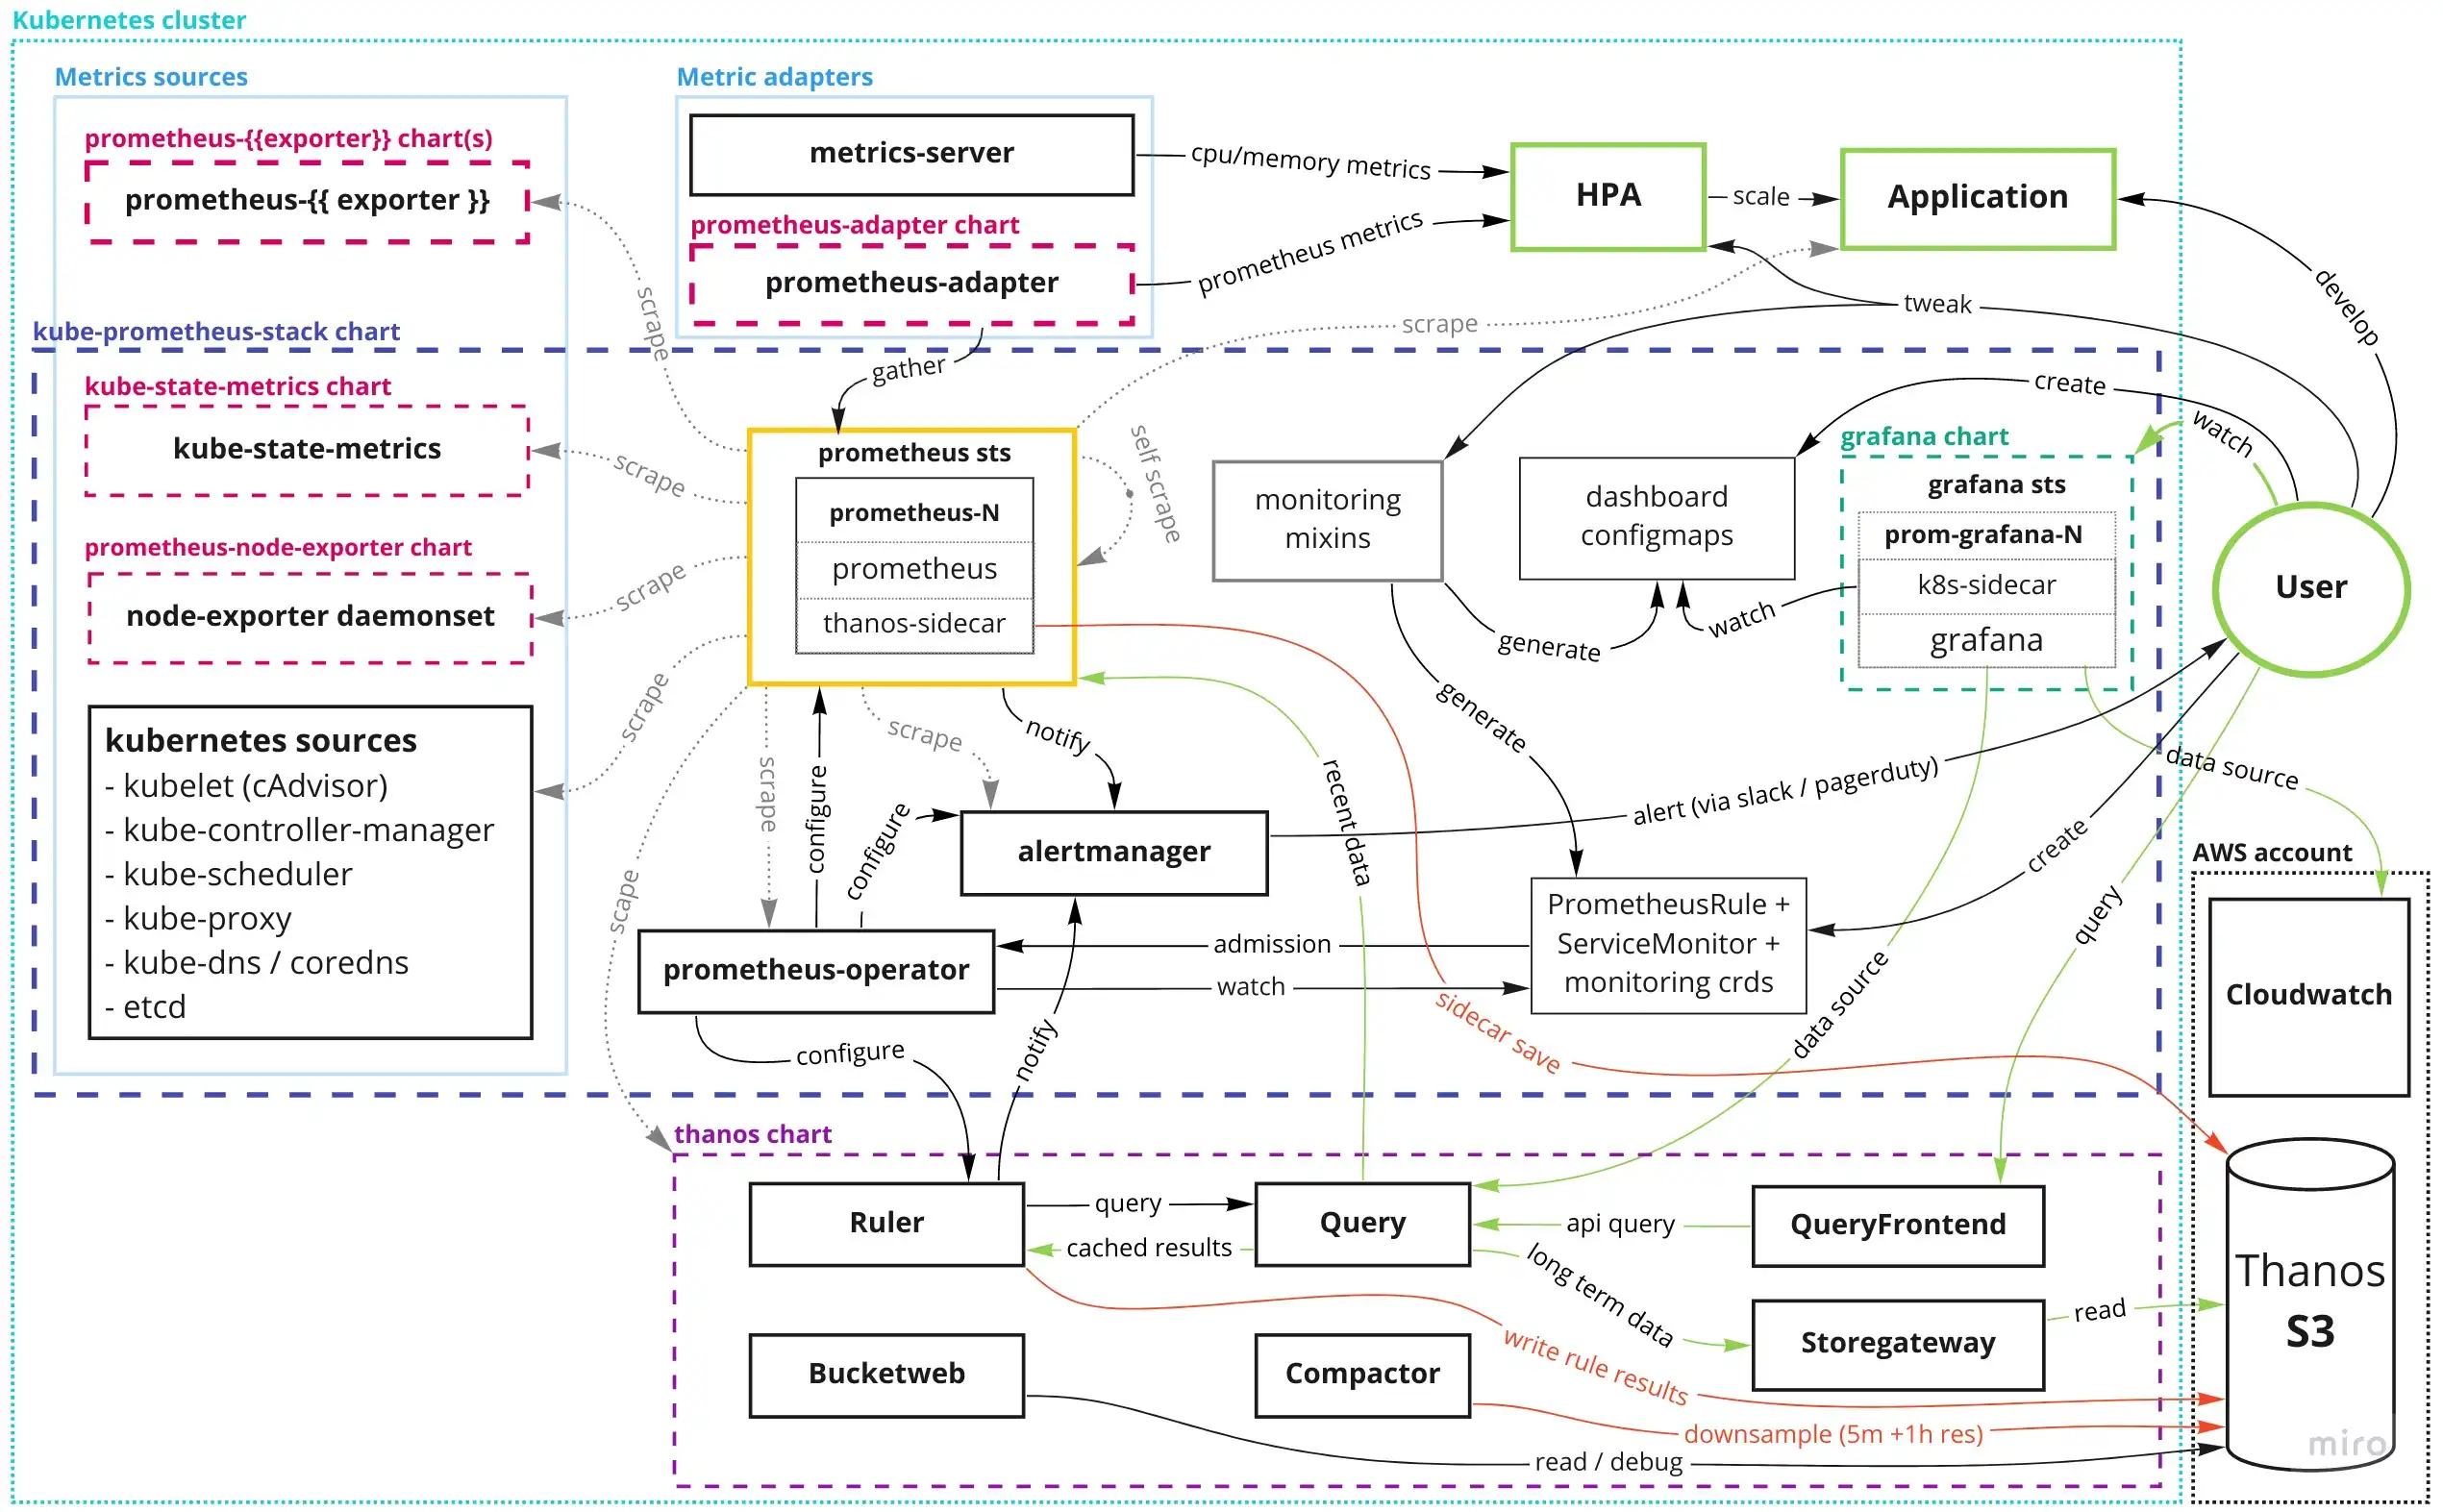
and we were planning to move to this:
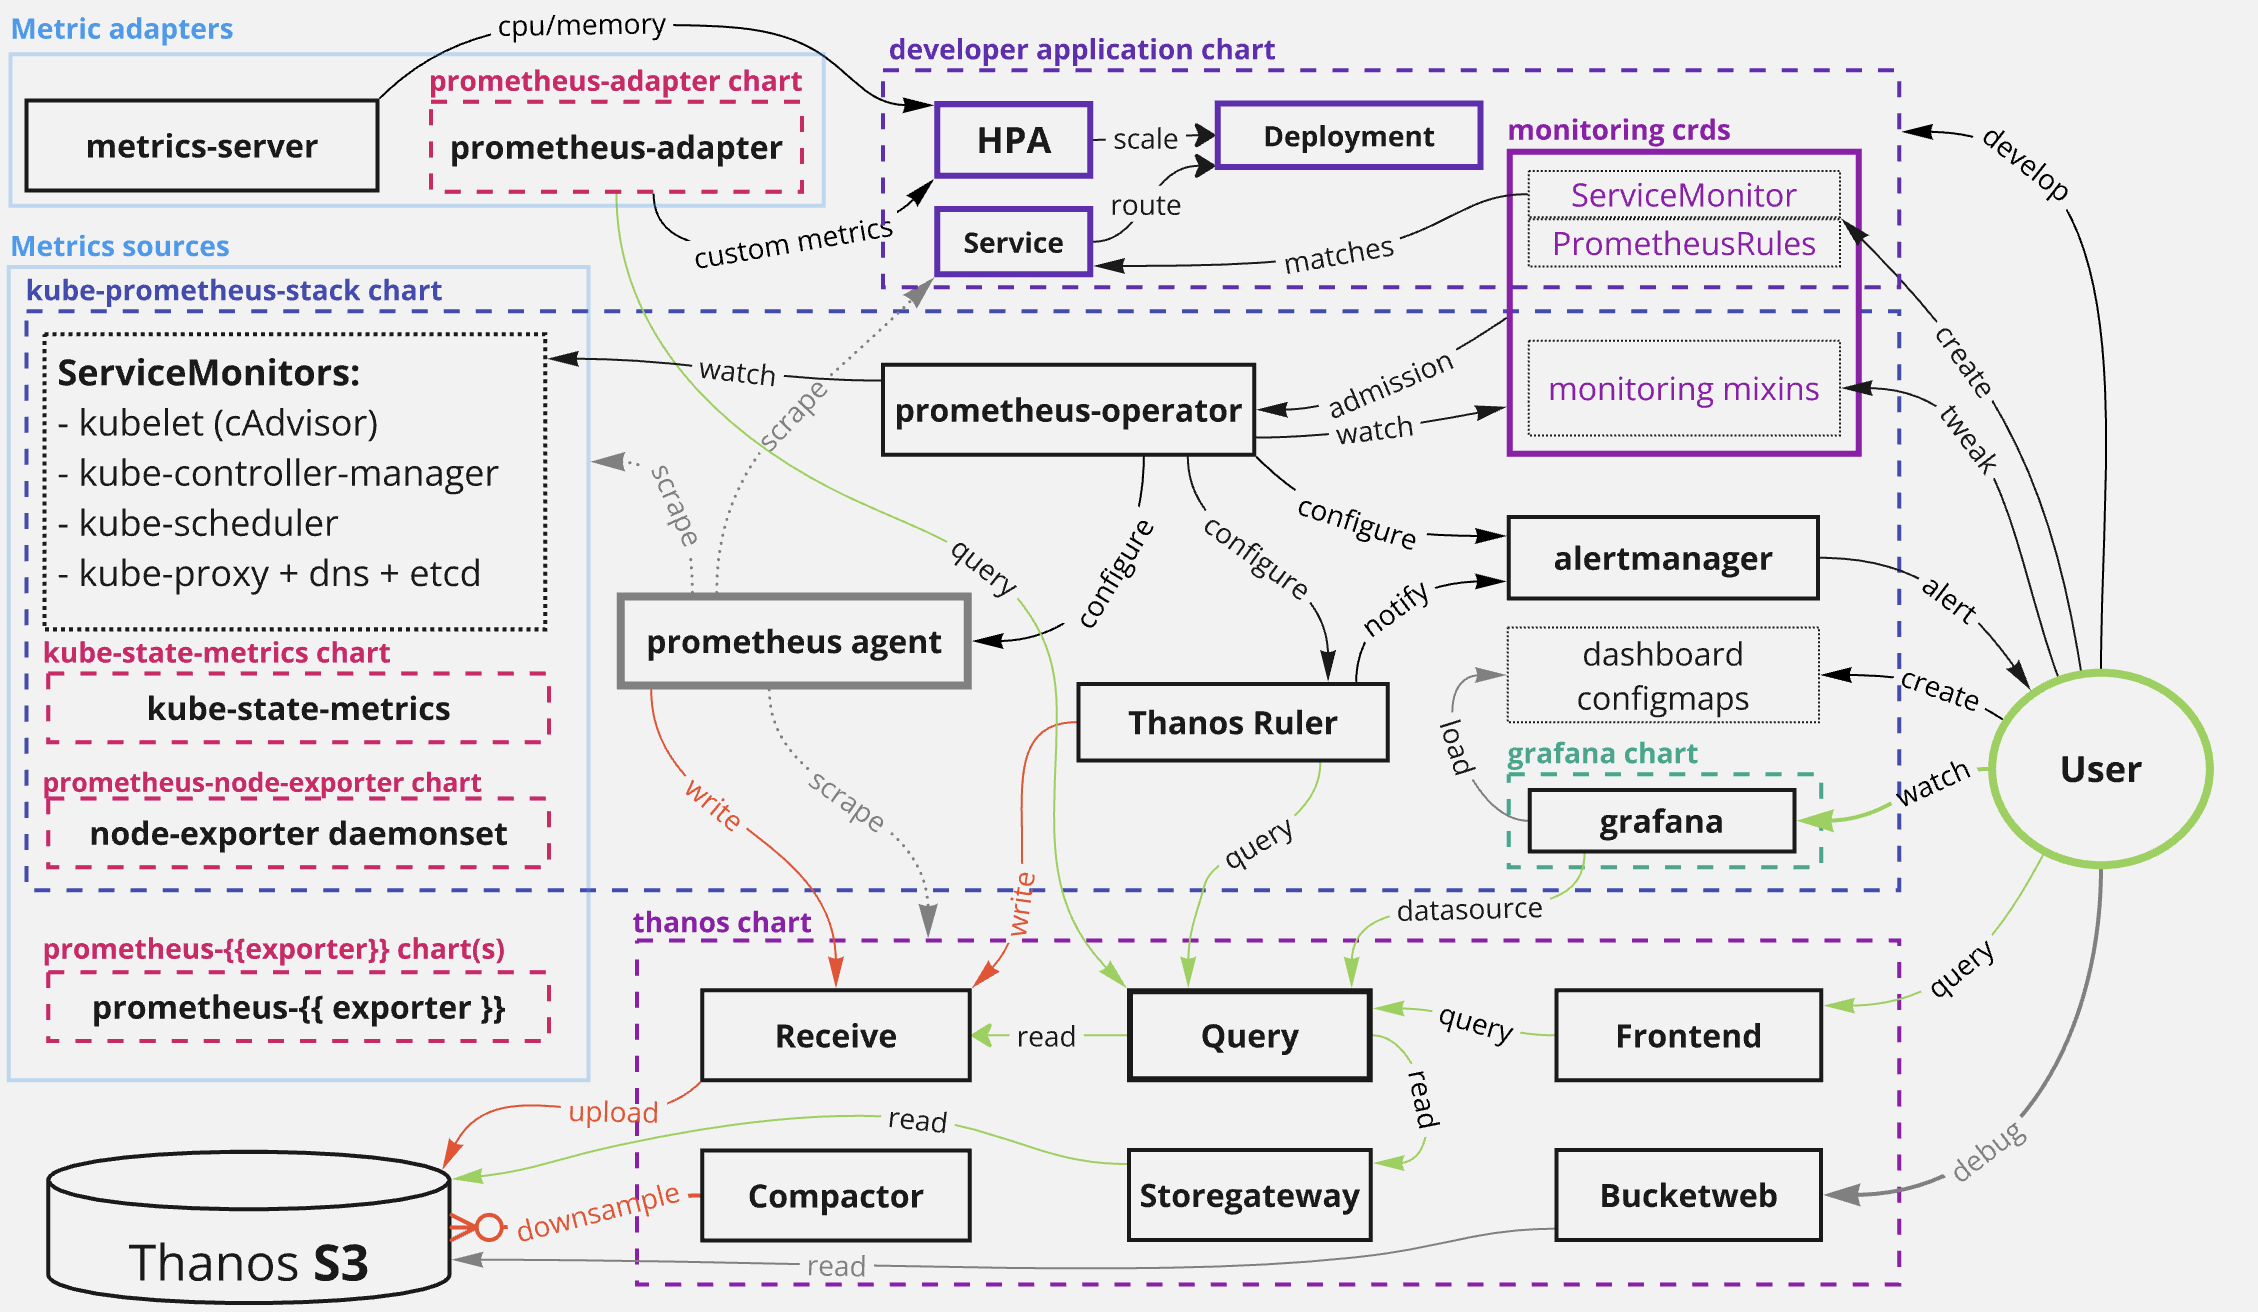
The key changes here:
- enable prometheus agent feature limiting it to scraping and remote writes to receive
- deploy thanos receive for short term metric storage + S3 uploader (no more sidecar)
- deploy thanos rule as new evaluator, posting to alertmanager
With the 3 components replacing prometheus (agent, receive, ruler) in-theory having better scaling characteristics by themselves, with a cleaner, and more delineated area of responsibility.
Why chase better scaling characteristics? A single prometheus grows in size/requests with amount of time series it scrapes, and it can only grow as long as you have enough RAM available. Eventually you run out of super-sized cloud nodes to run them. Have personally had to provision a 300GB memory node during a cardinality explosion, and would like to not deal with this ticking time bomb in the future.
Complexity & Pickup
While the original setup can hardly be considered trivial, splitting one component into 3 sounds like a simple addition in theory.
However, while splitting a monolith might sound like a nice idea, actually operating such a distributed monolith is a different proposition. The existing complexity is splattered across 3 components in statefulsets and helm template gunk, and the operational complexity is compounded by these components not being as battle tested as the more traditional prometheus/thanos setup.
3 Single Points of Failure
You will need improved alert coverage with the previous single point of failure getting split into 3 parts:
- ruler query failures means no alerts get evaluated even though metrics exists in the system.
- agent mode downtime means evaluation works, but metrics likely absent
- receive write failures / downtime means rule evaluation will fail
The setup suffers from the "who alerts about alerting failures" problem. A single deadman's switch is necessary, but not sufficient; as ruler can successfully send the WatchDog alert to your external ping service, despite the agent being down.
The mixins provide a good starting point for the new thanos components that can be adapted, but it takes a little time to grok it all.
Configuration Splits
Since thanos-ruler is the new query evaluator, and we use PrometheusRule crds, these crds must be provisioned into thanos-ruler via prometheus-operator. On the helm side, this only works with kube-prometheus-stack creating the ThanosRuler crd (which prometheus-operator will use to generate thanos-ruler), in the same way this chart normally creates the Prometheus / PrometheusAgent crd (to generate the prometheus or prometheus-agent pair).
Specifically, we have to NOT enable ruler from the bitnami/thanos chart, and have a thanos component live inside kube-prometheus-stack instead. Not a major stumbling block, but goes to show some of the many sources of confusion
There's a bigger stumbling block for
thanos-receive, but more on that in the speculation section.
New Features, Slow Iteration
Agent mode, with a writing ruler also feels fairly new (in prometheus time), and support for all the features generally takes a long time to fully propagate from prometheus, to thanos, to the operator.
As an example see; keep_firing_for:
- Nov 2022 :: Raised in prometheus (me, lazy)
- Feb 2023 :: Implemented in prometheus
- June 2023 :: Support in prometheus-operator for PrometheusRule
- Jan 2024 :: Support in thanos
- March 2024 :: Support in prometheus-operator for ThanosRuler
So as you can see, it's a long chain where ruler sits at the very end, and to me this it is indicative of the amount of use ruler realistically gets. To drive that home, I've also had to upstream remote write ruler functionality in the chart, and my minor issues in thanos sit untouched.
Anyway, not really trying to shame these projects, things take time, and volunteer work is volunteer work. But the clear outcome here is that many features are not necessarily very battle tested.
Performance Problems
Unfortunately, the performance from this setup (after weeks of tuning) was still 2x-3x worse than the original HA prometheus pair setup (again from the 2022 post / 1st diagram above). These new subcomponents individually perform worse than the original prometheus, and have worse scaling characteristics. Rule evaluation performance also seriously deteriorated.
Benchmark
Comparison is made using prometheus v2.53.1 and thanos 0.36.0 and consider mean utilisation measurements from cadvisor metrics on a cluster with a ~2.5M time series per prometheus replica. We only consider the biggest statefulsets (receive, prometheus/agent, ruler, storegw). In either setup receive or prometheus were running on a 3d local retention.
Results
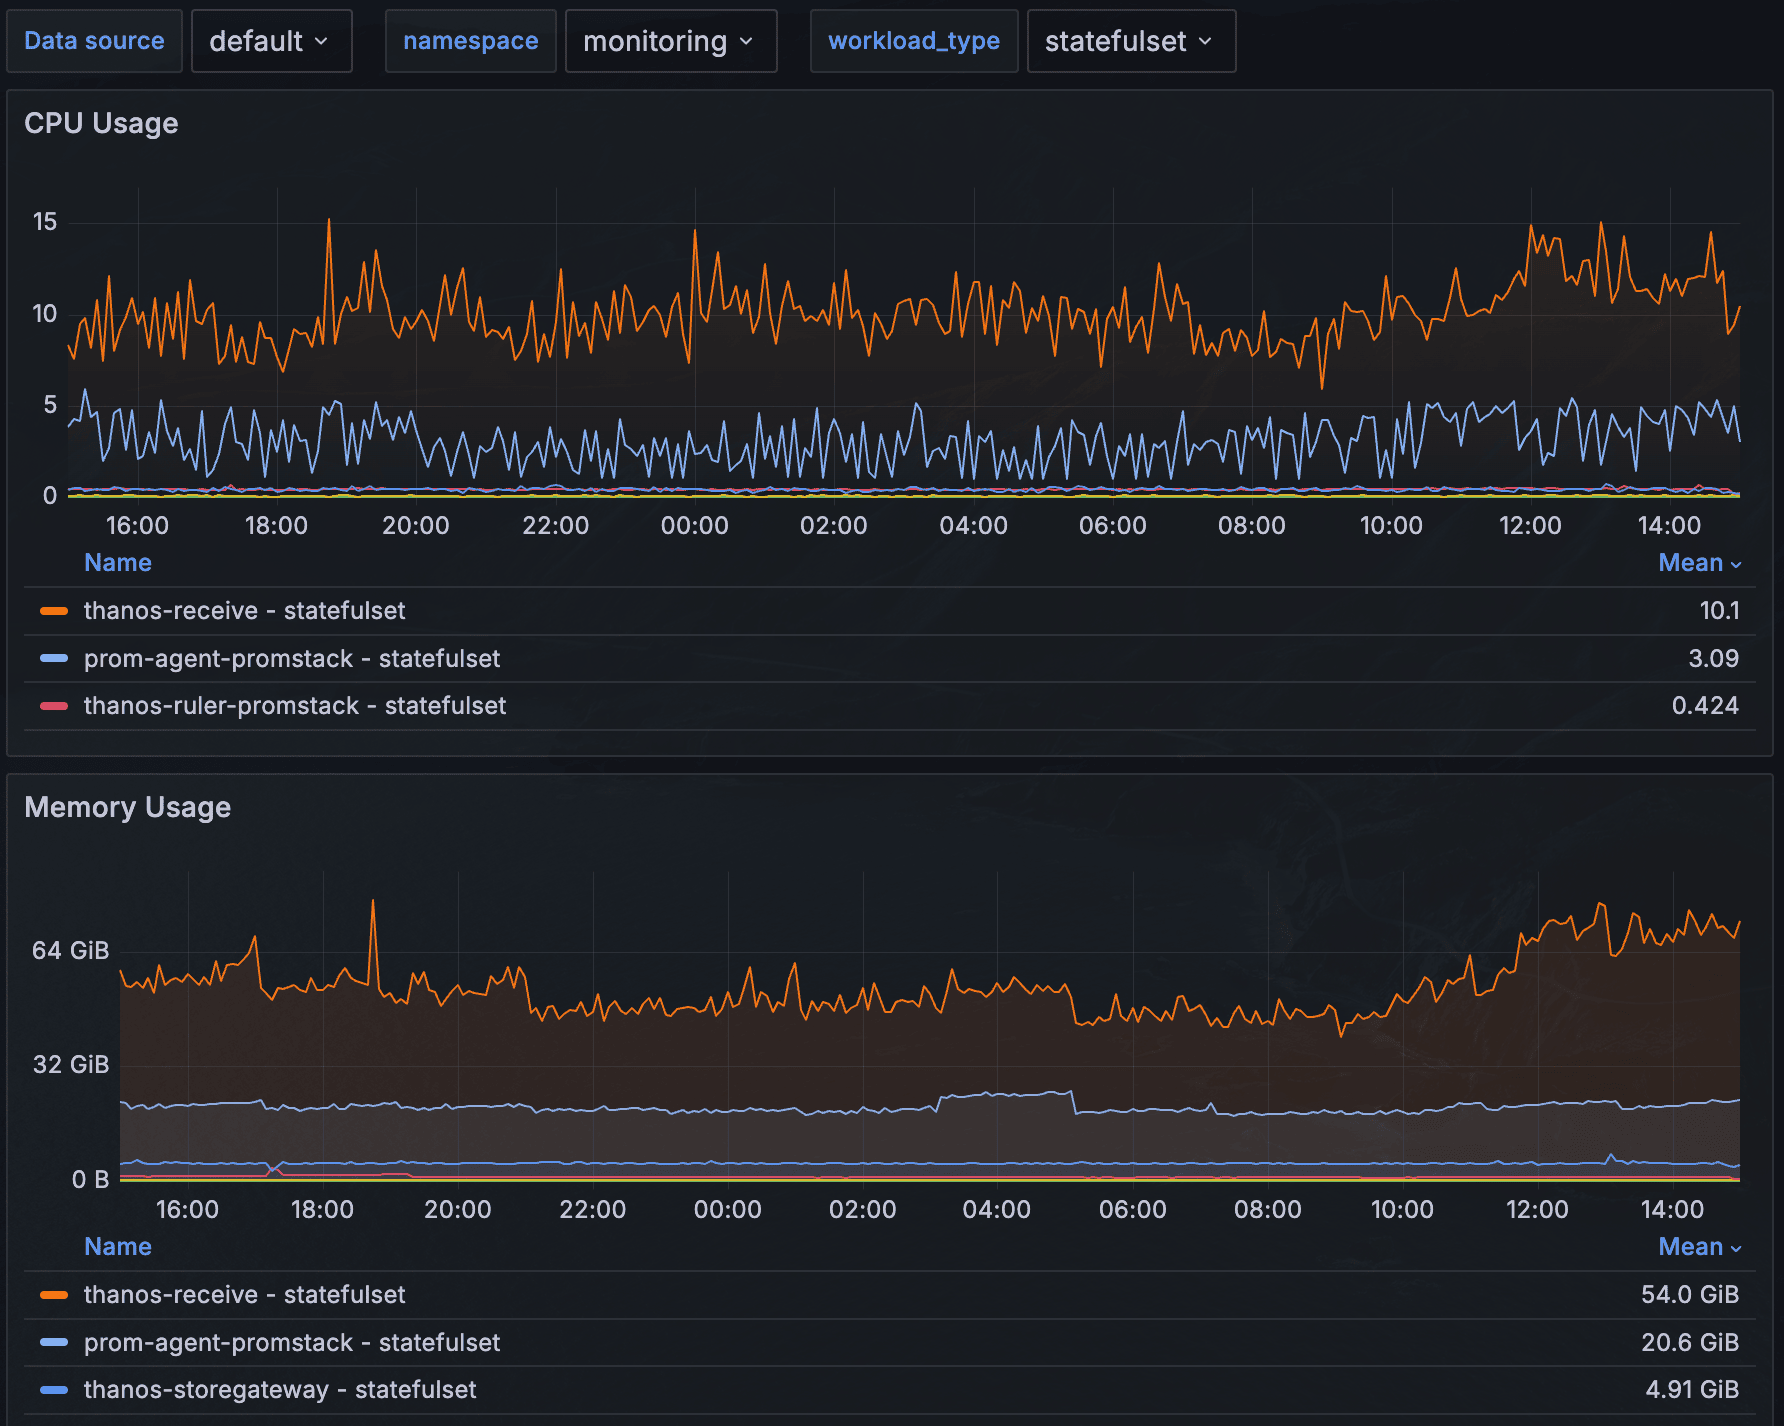
Over full workdays we saw ~13 cores constantly churning, and ~80 GB of memory used by the 3 statefulsets (10 cores and 50GB alone from receive):
Compare to the same setup using a normal HA prometheus (no ruler, no receive, local eval) and we have ~4 cores and <30GB memory:
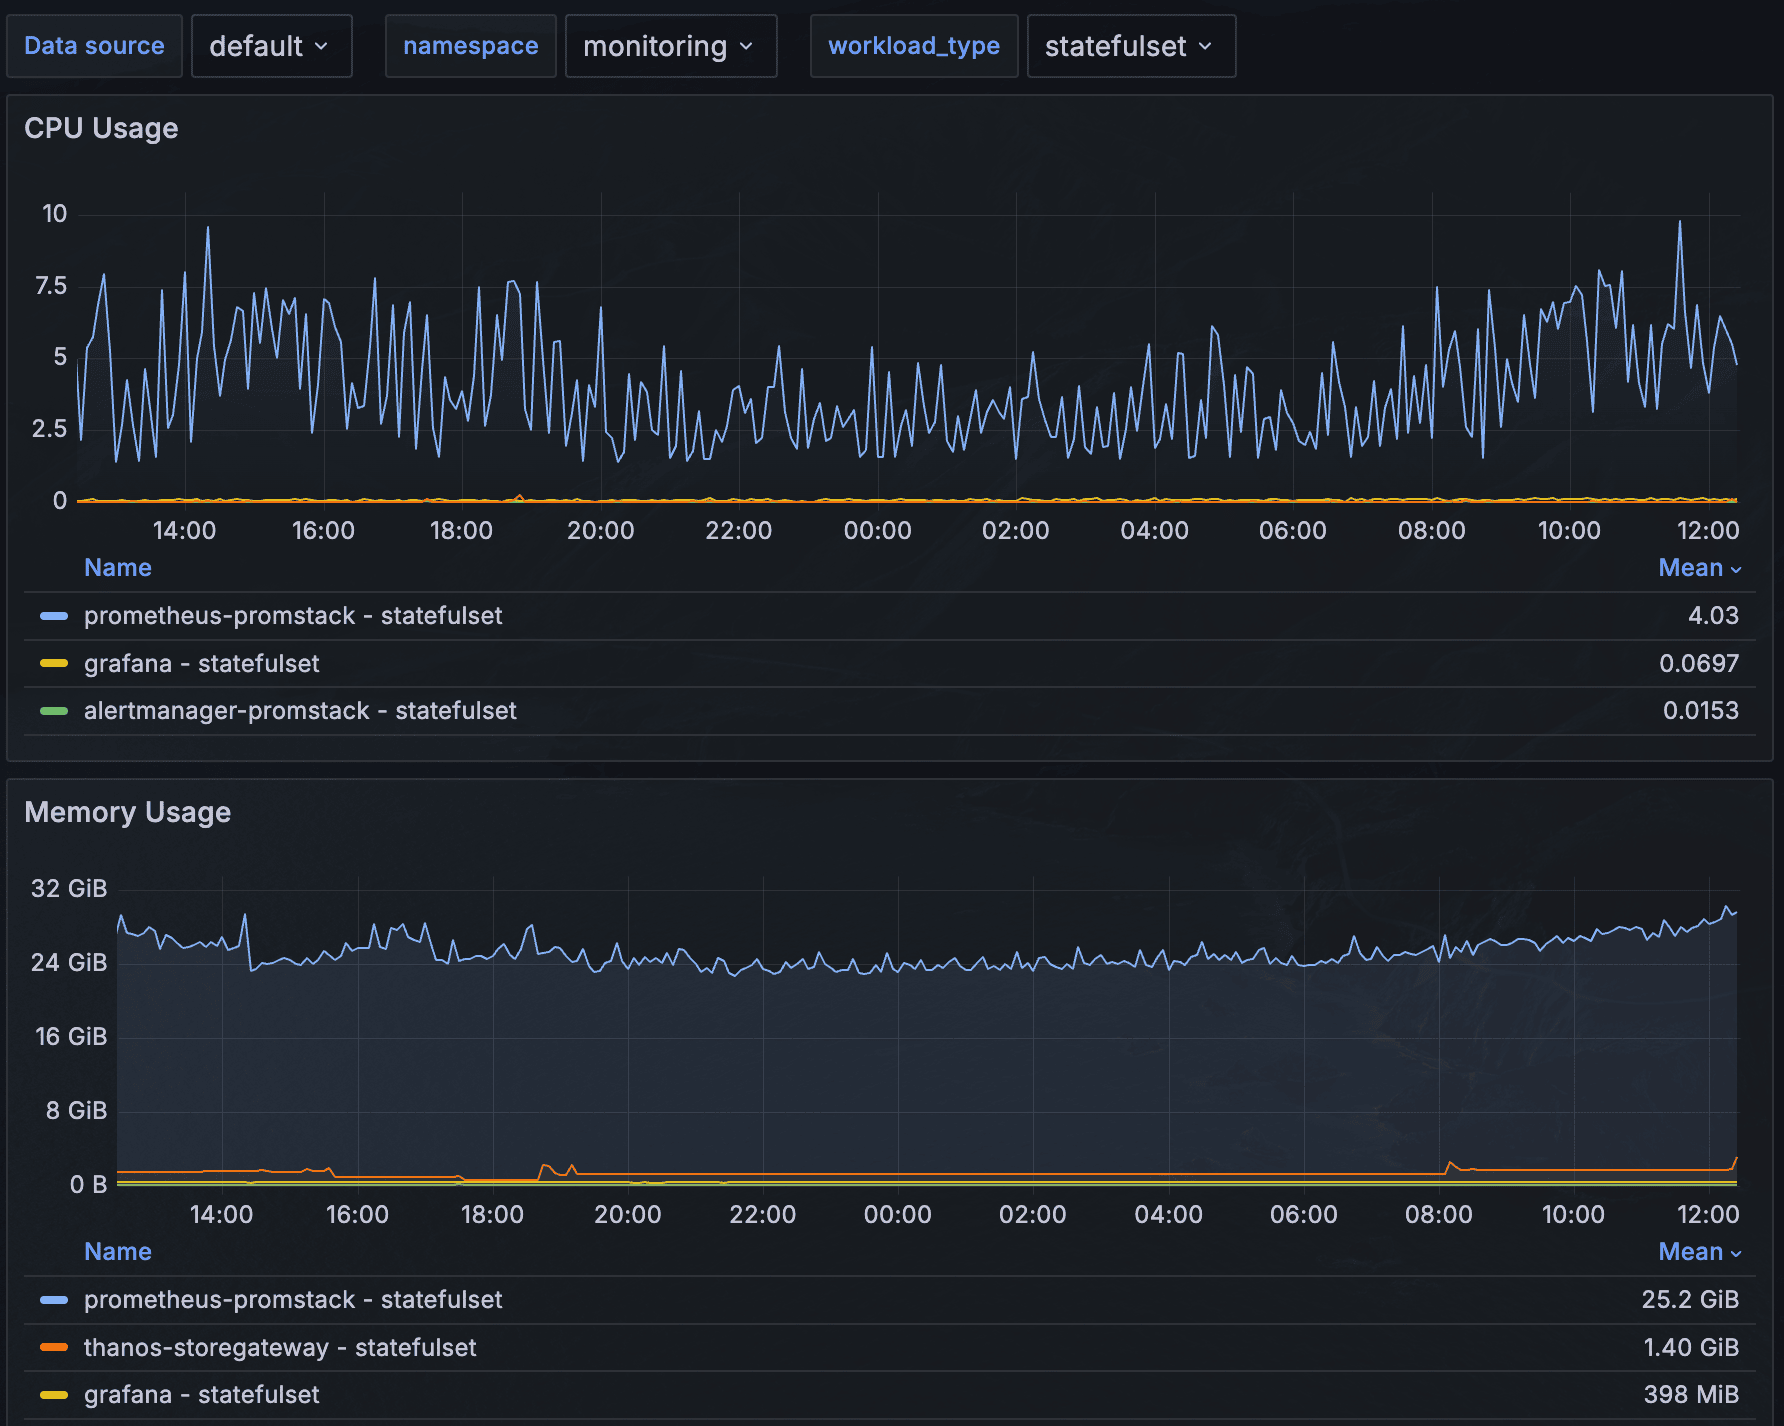
So cluster wise, we end up with a between 2x-3x drop by switching back to non-agented, monolithic prometheus.
Receive Performance
From the same graphs we see that the portion of prometheus that got factored out into thanos receive, is using roughly 2x the CPU and memory of a standalone prometheus, despite not doing any evaluation / scraping.
Addendum: Configuration Attempts
Tried various flags here over many iterations to see if anything had any practical effects.
- new ketama hashing algorithm
--enable-auto-gomemlimit- barely helps--tsdb.wal-compression- disk benefit only afaikt--receive.forward.async-workers=1000- irrelevant, receive does not forward requests in our setup
The receiver was run as minimally with 3d retention, and 1 replication factor, 2 replicas. More about this later.
Agent Performance
The agents (which now should only do scraping and remote write into receivers) are surprisingly not free either. From graph above, the memory utilisation is close to a full prometheus!
There is at least one open related bug for this.
Ruler Performance
Ruler evaluation performance when having to go through queriers is also impacted, and it surprisingly scales non-linearly with number of ruler replicas.
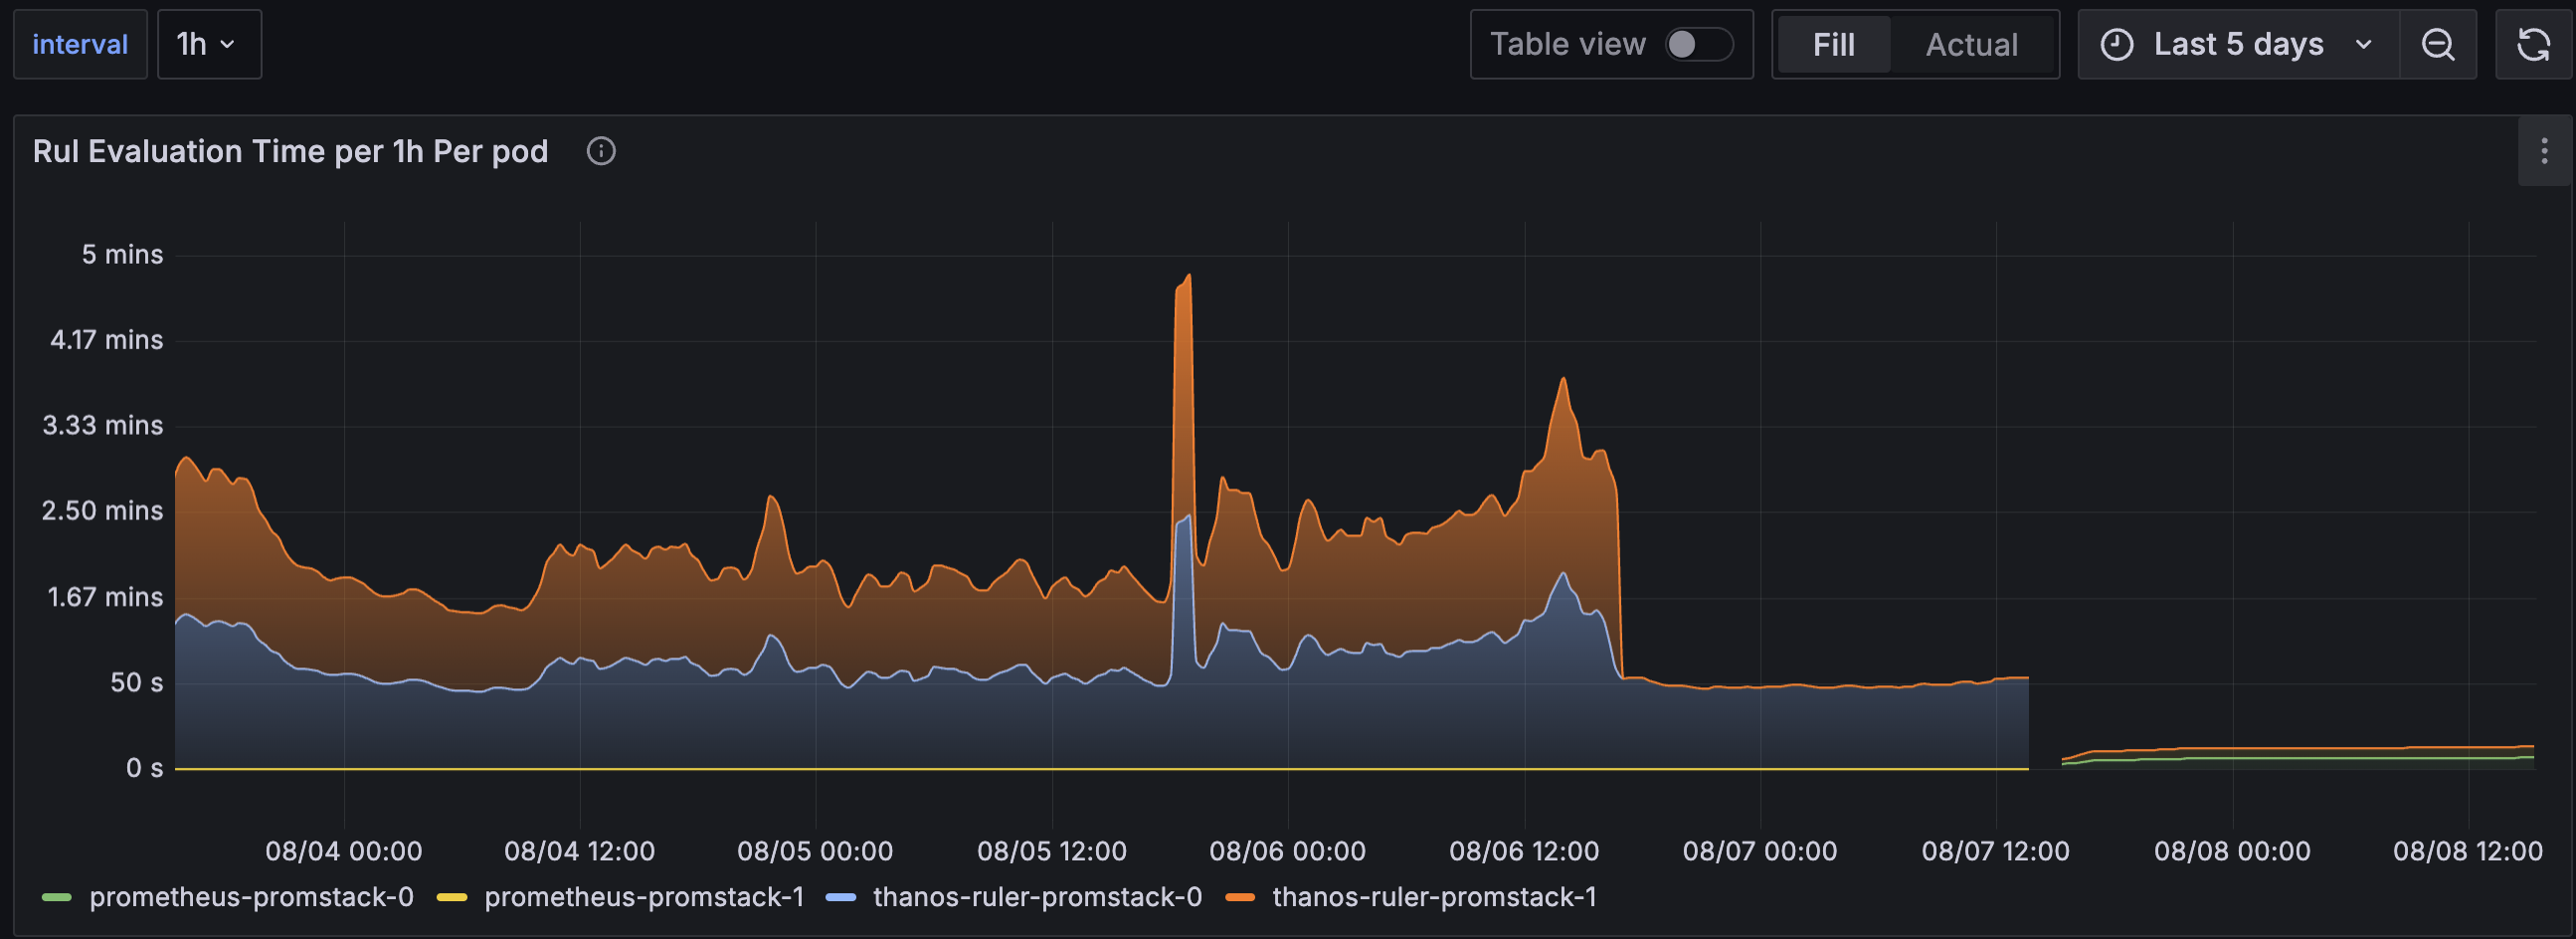
This panel evaluates sum(avg_over_time(prometheus_rule_group_last_duration_seconds[1h])) by (pod) per pod over three modes:
- up until 08/06 12ish :: 2 replicas of thanos ruler
- middle on 08/07 :: 1 replica of thanos ruler
- end on 08/08 :: 2 replicas of prometheus (non-agent mode)
As you can see the query time increases within each pod when increasing replicas. Possibly this is load accumulating in the new distributed monolith, but a near 50% spike per ruler? In either case, the actual comparison of 3s avg vs 50s avg is kind of outrageous. Maybe this is misreading it, but the system definitely felt more sluggish in general.
No rules generally missed evaluations, but it got close to it, and that was not a good sign given it was in our low-load testing cluster.
Beyond this, this component is nice; seemingly not bad in terms of utilisation, and easy to debug for the basics. Ruler metrics docs and sum(increase(prometheus_rule_evaluation_failures_total{}[1h])) by (pod) in particular were very helpful.
Speculation
..on why it performs like this, and on whether we are expecting too much from this setup.
Removing Colocation
This is tiny brain post-rationalisation, but maybe having a big block of memory directly available for 3 purposes (scrape / storage / eval) without having to go through 3 hops and buffer points (ruler → query → receive) is a big deal.
Split Receivers
There is a lot more complexity under the surface of for actually running receive well. I ran the basic setup, and probably paid for it.
For people that need to go deeper; there's a split receiver setup, and a third-party controller to manage its hashring that people recommend to avoid write downtime (not a problem I even noticed). By using it right, supposedly we get to double the utilisation again.
My lazy take here is that if the system performs badly with replication factor 1, the prospect of more complexity and a futher utilisation increase is not particularly inviting. Even if such a system scales, paying your way out of it with this much pointless compute resources feels wrong.
Bigger Evaluation Window
There is a chance that a good portion of the ruler time has come from going through thanos-query.
Routing like this was a deliberate choice so that people could write alerts referencing more than 3d (local retention) worth of data to do more advanced rules for anomaly detection. This should not have impacted most of our rules since most do not do this type of long range computations..
I tried moving the ruler query endpoint directly to receive to try to falsify this assumption, but this did not work from ruler using the same syntax as query/storegw.
Wrong Tool For the Job
Agent mode on the prometheus side seems perhaps more geared to network gapped / edge / multi-cluster setups than what we were looking for judging by the grafana original announce + thanos receive docs).
It’s also possible that other solutions perform better / are better suited, e.g. grafana mimir. This is all speculation.
Confusing Agent Promise
Perhaps the most confusing thing to me is that agent mode does not act like an agent.
You cannot run it as a DaemonSet, you merely split the monolith out into a distributed monolith. This is a present-day limitation. Despite people willing to help out, the issue remains unmoving. I had hoped google would upstream its actual statefulset agent design (mentioned in the issue), but so far that has not materialised. Who knows if agent mode will even become stable.
On the grafana cloud side, the grafana agent did support running as a daemonset, but it is now EOL.
It’s been only 3 years since agent mode was announced. Now, 2 years later the whole remote write protocol is being updated and just landed in prometheus.
So, what I am trying to say; who knows what the future really brings here. It might be another couple of years before new remote write gets propagated through the thanos ecosysystem.
Scaling Alternatives
Sharding
Maybe the better way forward for scaling is not to twist prometheus into something it's not - and create a staggeringly complex system - but by making more prometheuses.
For instance; prometheus operator's sharding guide can help partition a classic prometheus, but you do need partition and label management, uneven shard request (cpu/mem) management (due to some shards scraping more metrics and thus having more load), so it's definitely on the more manual side.
brain: ..you would also need to split kubelet metrics across namespaces (or whatever you use as your shard) via some templated servicemonitor, and you'd need a bunch of templated datasources in your master grafana that your dashboards would need to be parametrised for. Maybe you also need one main-cluster prometheus that can scrape all the kubelet metrics for cluster-wide views.
Not impossible, but clearly also an amount of faff. This is standard configuration faff though; not distributed systems faff.
Lowering Local Retention
If the problem is delaying scaling up to something complex, we could also lean on the classic thanos split and keep reducing local prometheus retention time down to a single day or lower (as long as you are quick on detecting sidecar failures so you don't lose data).
This is a temporary solution though. On my homelab I can run 30d retention, but with 5M time series - in a company setting - I need 3d to maintain a sensible utilisation.
Cardinality Enforcement
This is the "unscaling" approach I run in my homelab. Granted it is easier to justify there, but there are real concrete steps you can do to really reduce the prometheus utilisation:
- drop big histograms (easy) / move to native histograms (..some day)
- dropping pod enrichment (big replica counts X histograms = lots of cardinality, impossible without stream aggregation tho)
- Monitor your ingestion:
by (job), before and after relabellings, put alerts on fixed ingestion numbers - Make sure everyone uses
{Service,Pod}Monitors so above step is feasible - Drop most of kubelet metrics (most metrics are unused by dashboards or mixin alerts)
I'll probably explore this approach in more detail later on, because I think it's the most sensible one; dilligence on the home court avoids all the complexity.
In the mean time, post is on mastodon, source is in the probes repo.
Future
No matter how you slice it, agent mode with thanos is certainly a complex beast whose configuration entangles a huge number of services; agent, operator, receive, query, store, compactor, ruler, adapters, alertmanager, grafana. You have a choice in how difficult you make this.
The performance characteristics measured above, while not initially impressive to me, is one point, but the complexity of the setup is what pushes it over the edge for me. If the stack becomes so complex that the entire thing cannot be understood if one key person leaves, then I would consider that a failure. This was hard enough to explain before receive and agent mode.
If I have to wrangle with cardinality limits, relabellings, label enrichment, or create charts to multiply prometheuses, then this all seems more maintainable than receive.